
Grafana boards
If your team already lives in Grafana, CritterWatch sits beside it. Grafana is where you watch a rate move; CritterWatch is where you do something about it. The board pack here answers the first half from the same Prometheus series the console reads.
What ships
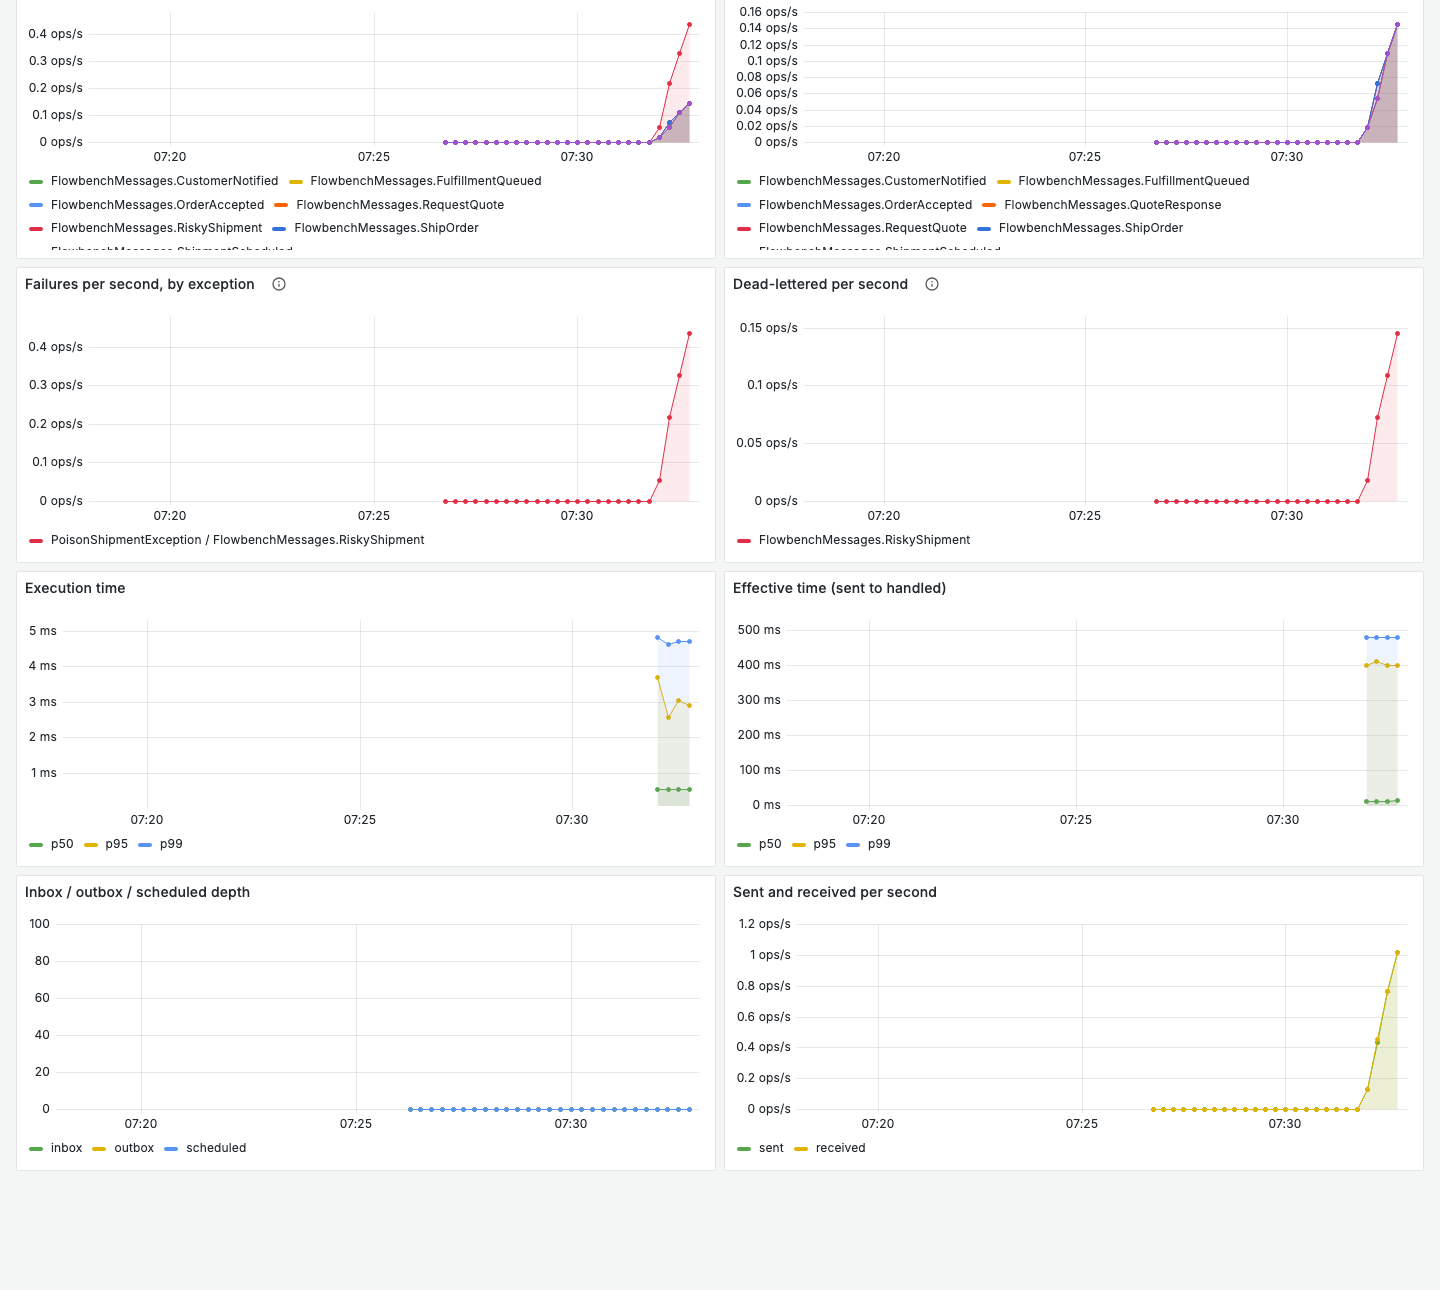
docker/grafana/dashboards/wolverine-messaging.json is a plain Grafana dashboard. Import it into any Grafana (Dashboards, New, Import, upload the file) and pick your Prometheus data source. It has a service variable (multi-select) and these panels:
| Panel | Series |
|---|---|
| Handled per second, by message type | wolverine_execution_time_Milliseconds_count |
| Succeeded per second | wolverine_messages_succeeded_Messages_total |
| Failures per second, by exception | wolverine_execution_failure_Messages_total |
| Dead-lettered per second | wolverine_dead_letter_queue_Messages_total |
| Execution time p50 / p95 / p99 | wolverine_execution_time_Milliseconds_bucket |
| Effective time p50 / p95 / p99 | wolverine_effective_time_Milliseconds_bucket |
| Inbox / outbox / scheduled depth | wolverine_inbox_count_Messages, wolverine_outbox_count_Messages, wolverine_scheduled_count_Messages |
| Sent and received per second | wolverine_messages_sent_Messages_total, wolverine_messages_received_Messages_total |
The names are not the ones Wolverine declares
Wolverine declares wolverine-execution-time. The OpenTelemetry Prometheus exporter bakes the instrument's unit into the series name (..._Milliseconds_bucket, ..._Messages_total), and service identity arrives in the source label, not job or service. The inbox, outbox and scheduled gauges are the exception: they carry no source label, so the board filters them on otel_scope_name, which is Wolverine:<ServiceName>. A board written from the declared names renders every panel empty. Wolverine's meter is also named Wolverine:<ServiceName>, so register AddMeter("Wolverine*").
Try it on the dev fleet
docker compose up -d grafana starts Grafana on http://localhost:3000 with the board and both data sources (Prometheus and VictoriaMetrics) provisioned, anonymous admin enabled for local use only.
The dev fleet's Prometheus scrapes the two Flowbench services that carry traffic (FlowbenchStorefront on :9470, FlowbenchFulfillment on :9471). Both are Marten-backed with a durable inbox and outbox, and POST /flowbench/f5/run on the Storefront produces a dead letter, so every panel on the board has something to show. Fire a few of /flowbench/f1/run, /flowbench/f4/run and /flowbench/f5/run, wait a scrape interval, then verify.
Check a board before you trust it
scripts/verify-grafana-boards.py http://localhost:9090It runs every panel query against Prometheus and exits non-zero if any returns no series, so a renamed series or a missing meter is a red, not a blank panel. Run it against a Prometheus that is scraping a live service.
Where CritterWatch takes over
A Grafana alert tells you the dead-letter rate is up. The dead letters page shows the envelopes, groups them by failure, and replays or discards them. The same goes for pausing a projection, rebuilding it, or cancelling a scheduled message: Grafana has no way to act on a Wolverine node.