
UI Overview
CritterWatch provides a Vue 3 single-page application served from the CritterWatch server. All views update in real time via SignalR — no manual refresh required.
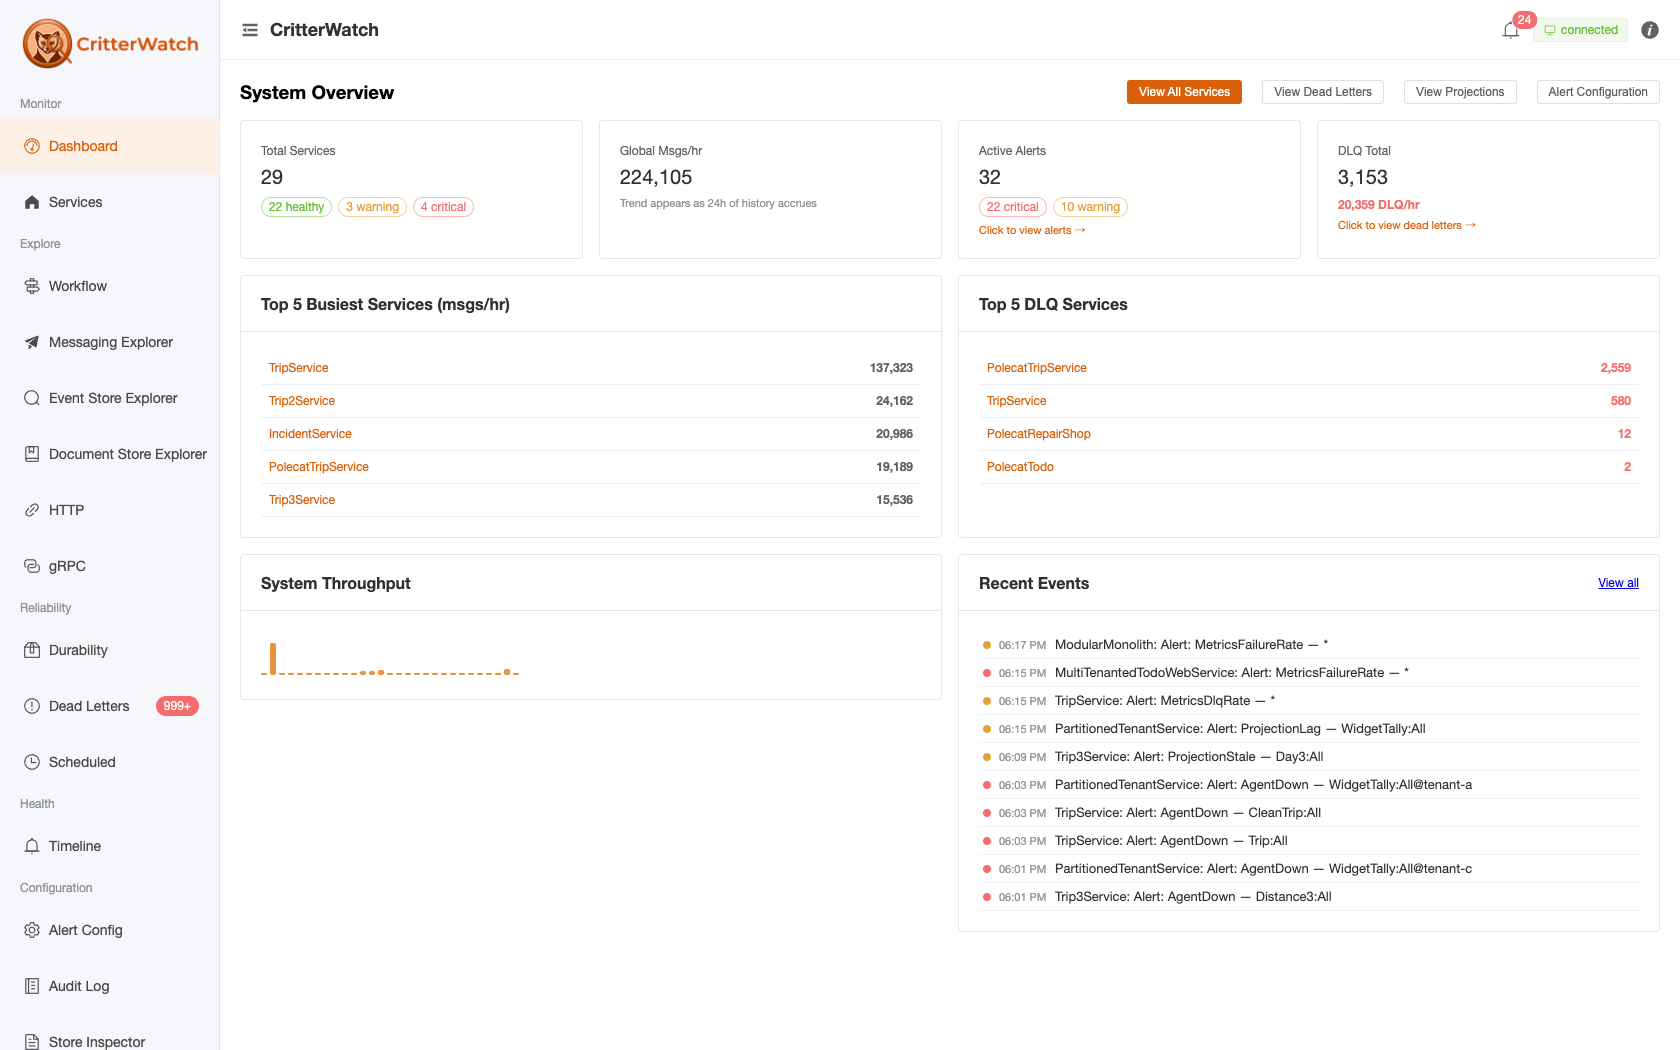
Navigation
The sidebar is organised into groups. Each group collects the screens you reach for at the same stage of an investigation. The header always shows the current page's title — that header title is the page's heading (pages don't render a page-level heading of their own; anything below it is section-level), and most explorer pages show a one-line description under it. The sidebar collapses to an icon-only rail — click its right-edge divider to toggle; the collapsed rail shows each item's name on hover.
Monitor
| Section | Description |
|---|---|
| Dashboard | Fleet-wide health summary — top busiest / DLQ services, throughput, recent events |
| Services | Per-service detail: Overview capabilities, event store, durability, cluster, health & metrics |
Explore — fleet-wide explorers, each deep-linkable to a single service with ?service=
| Section | Description |
|---|---|
| Workflow | "Where does this type fit?" — a message/event/saga traced across services as an interactive flow graph or Event Modeling lanes (see Workflow) |
| Conversations | "What actually happened to this one message?" — a concrete instance's real send/receive/execute chain as a causal graph or a compacted timeline, captured live with no tracing backend (see Conversations) |
| Messaging Explorer | Messages catalog, routing, topology graphs, brokers, and the Endpoints grid in one place (see Topology, Message Routing, Endpoints) |
| Event Store Explorer | Streams, events, projection operations, and event-store configuration (see page docs) |
| Document Store Explorer | Document mappings and metadata-filtered document queries across stores (see page docs) |
| EF Core Explorer | Every EF Core DbContext registered across services — Wolverine-integration badges, entity maps, pending-migration probes (see page docs) |
| Saga Explorer | Sagas across services, with per-saga state shape and live instance drill-in (see page docs) |
| Schedule Explorer | The recurring cron schedules registered across the fleet — cron, time zone, next occurrence, pause/resume (see page docs) |
| HTTP | The fleet's ASP.NET endpoint surface — Wolverine chains + Minimal API/MVC/Razor/SignalR rows — with chain detail (see ASP.NET Endpoints, HTTP Chain Detail) |
| gRPC | Every Wolverine-mapped gRPC service method across the fleet — stream kind, forwarded message, response, dispatching chain — with per-RPC detail |
Reliability
| Section | Description |
|---|---|
| Durability | Inbox/outbox sparklines and persistence queue depths |
| Rebuilds | Projection rebuild orchestration — running/completed rebuild runs with retry and cancel |
| Dead Letters | DLQ explorer with replay, discard, and edit capabilities |
| Scheduled | Queued messages awaiting future delivery — the occurrences, where Schedule Explorer has the schedules |
Health
| Section | Description |
|---|---|
| Timeline | Chronological system event + operator-action feed |
Configuration
| Section | Description |
|---|---|
| Alert Config | Per-service alert thresholds and baselines |
| Audit Log | Record of operator-initiated actions |
| Store Inspector | The console's own live frontend state — Pinia stores + the SignalR message log (/raw); a debugging surface, not a data browser |
| Settings | Trace-provider and metrics-source bindings |
Retired top-level items. Earlier builds had standalone Projections, Listeners, Topology, and Event Store nav items. These were folded into the explorers above:
/projections,/listeners,/topology, and/eventsnow redirect into the Event Store Explorer / Messaging Explorer, so old bookmarks still resolve. There is no separate "Alerts" page — active alerts surface on the Timeline and on each service's Health & Metrics tab; thresholds live under Alert Config.
New to a system? Several of the Explore screens read your running application's structure back to you — its message flows, event model, generated HTTP surface, and installed schema, all assembled live rather than drawn by hand. Understanding Your System maps those reflection surfaces and the order to reach for them.
Global Service Filter
A service selector at the top of the page lets you focus the console on a single service. When a service is selected:
- Metrics, alerts, DLQ entries, and projections are scoped to that service
- Timeline events are filtered to show only that service's activity
- Commands are pre-populated with the selected service name
This is particularly useful during incident investigation — select the affected service and the filtered views show only relevant data.
The filter is hidden on the Dashboard and Services screens: the Dashboard is a fleet-wide overview with no per-service context, and the Services list already carries its own scoping, so a global filter there would be a no-op.
Real-Time Updates
All data is pushed from the CritterWatch server via a WebSocket connection (SignalR). A connection pill in the header (far right, beside the alerts bell) shows:
- Green "connected" — receiving live updates
- Yellow — reconnecting (brief connection interruption)
- Red — disconnected (server unreachable)
Next to the connection pill, a data-freshness pill ("12s ago" with a refresh icon) shows how long ago the last live update landed — a quick tell for "is this screen actually current?" when something looks stale.
When the connection is lost, CritterWatch automatically attempts to reconnect with exponential backoff.
Per-Node Liveness Dot
A small coloured dot sits beside every node number on the Services and Node detail pages. It tracks a quick liveness ping each running service sends to CritterWatch every 30 seconds — green when the most recent ping arrived within the last minute, amber after one missed beat, red after five. See Services → Heartbeat dot for the full thresholds, what each colour means, and what to check first when one turns red.
View Modes
Some views (notably Services, and the Cluster tab's nodes/agents) offer a Card/Table toggle:
- Card view — visual grid with health status badges, suitable for at-a-glance monitoring
- Table view — sortable, filterable data table for detailed comparison
Keyboard Shortcuts
| Shortcut | Action |
|---|---|
? | Show keyboard shortcuts |
g d | Go to Dashboard |
g s | Go to Services |
g t | Go to Timeline |
g e | Go to Events (Event Store Explorer) |
g a | Go to Alert Config |
g l | Go to Audit Log |
/ | Focus the global service filter (no-op where the filter is hidden) |
Escape | Close modal / clear filter |