Alert Configuration
The Alert Configuration page (/alerts/config) is where you tune what counts as a problem. CritterWatch ships sensible defaults, but every system has its own definition of "slow" and "behind" — this page is the single point where you change them.
The page has three top-level tabs:
Metrics · Projections · HistoryThe first two configure what raises alerts; the third audits what changed, when, and by whom.
Live Preview
A preview card sits above the tabs and continuously evaluates the current thresholds against the most-recent metrics buckets. As you edit the thresholds the preview updates so you can see what would fire right now if you hit Save. Useful for tuning a Critical threshold without burning a real alert.
| Preview column | Meaning |
|---|---|
| Severity | Warning / Critical that would fire |
| Service | Which service is over the limit |
| Message Type / Shard | The specific dimension at fault |
| Current Value | What the live metric reads |
| Threshold | What the configured threshold says |
The preview is read-only — saves only happen when you click an explicit Save button on the section that owns the change.
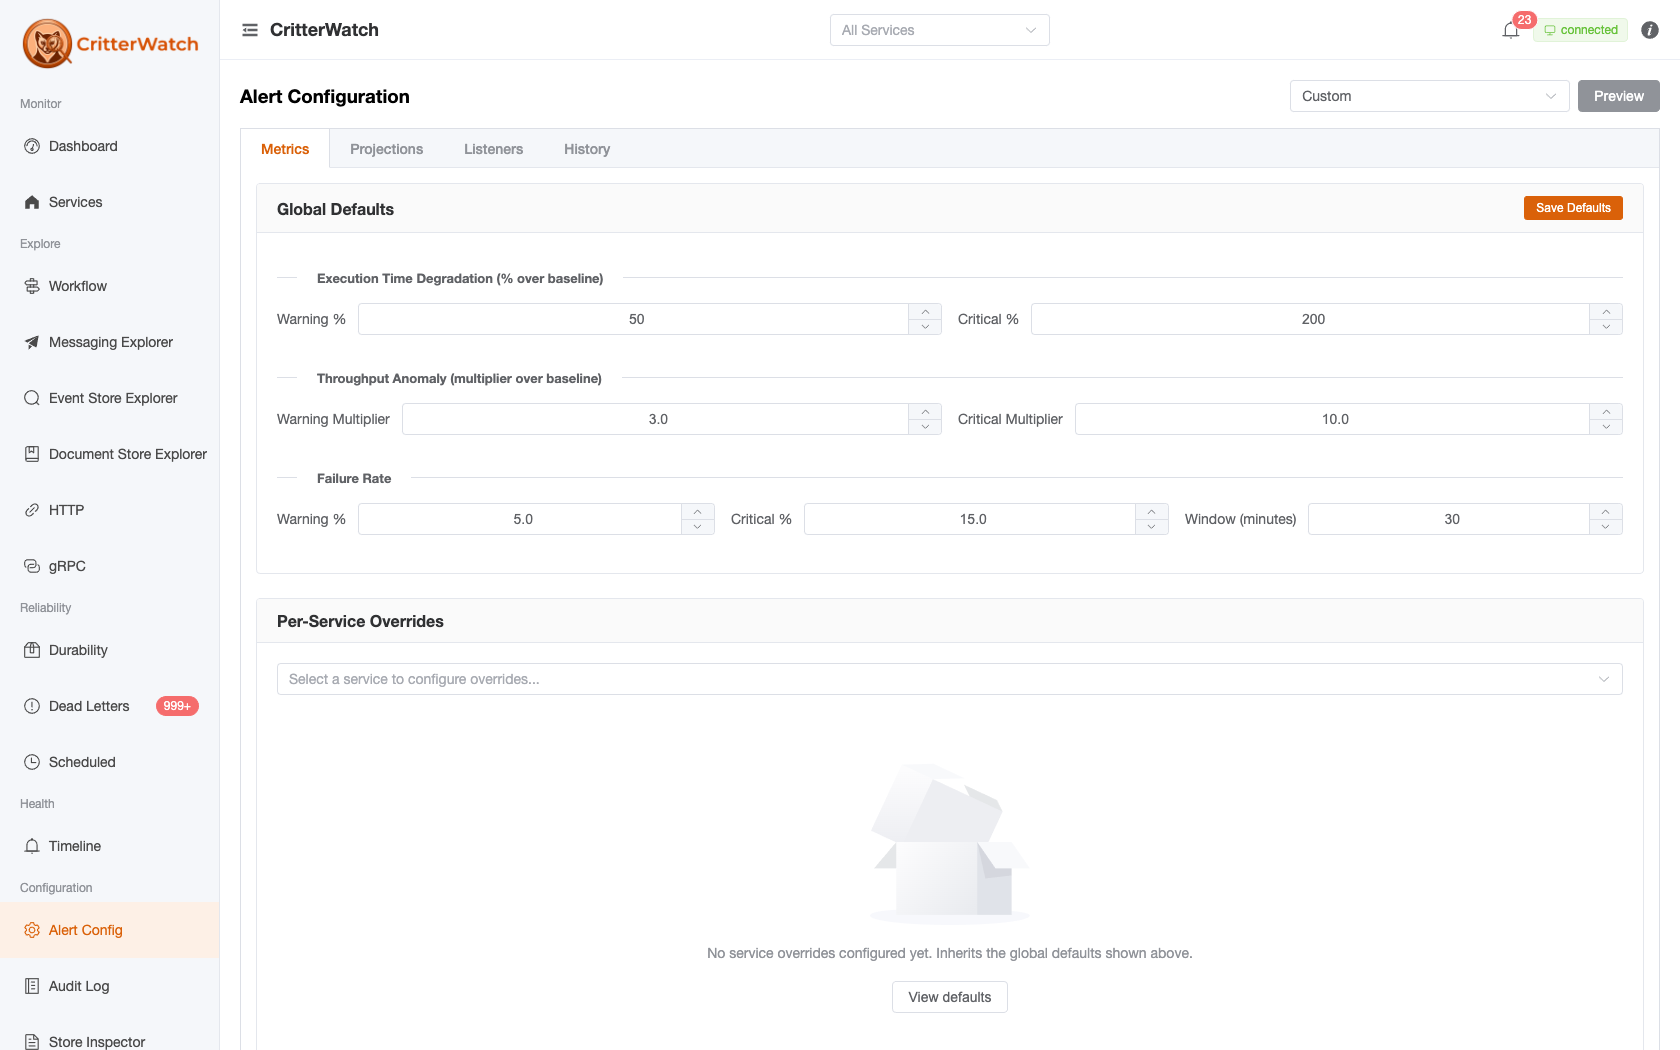
Metrics Tab
Metrics-side alerts fire on three dimensions: execution-time degradation, throughput anomalies, and failure rate. Each dimension has a global default plus optional per-service and per-message-type overrides.
Global Defaults
| Section | Threshold |
|---|---|
| Execution Time Degradation | Warning % over baseline · Critical % over baseline |
| Throughput Anomaly | Warning multiplier over baseline · Critical multiplier over baseline |
| Failure Rate | Warning % · Critical % · Window minutes |
The execution-time and throughput thresholds are relative — they fire when current metrics exceed the declared baseline by N percent / N times. The baselines come from WolverineCritterWatch.DeclareBaseline(...) blocks in the monitored service. If a baseline isn't declared, that dimension simply doesn't alert.
The failure-rate threshold is absolute — it fires when the failure percentage in the rolling window exceeds the configured percentage. The window controls how long an outage has to last before it crosses the threshold; small values are noisy, large values lag.
Per-Service Overrides
Pick a service from the dropdown to configure overrides just for that service. Each form field shows an "Inherited (X)" tag when it falls back to the default and an "Overridden" tag when an override is set. Empty / null fields inherit; non-empty fields override.
A service-level override also picks the metrics data source for that service:
| Source | Meaning |
|---|---|
WolverineRuntime | Default — pull live metrics from the in-process Wolverine OTel meter |
Prometheus | Scrape the configured Prometheus endpoint |
VictoriaMetrics | Scrape the configured VictoriaMetrics endpoint |
When Prometheus / VictoriaMetrics is chosen, an endpoint URL field appears.
Per-Message-Type Thresholds
The bottom of the Metrics tab takes a free-text "Add message type" input and lets you set per-message-type overrides on top of any service-level overrides. Same field shape as Per-Service Overrides; same inheritance tagging.
Useful pattern: for a slow-by-design batch handler, set its execution-time Warning % well above the service default so it doesn't drown the on-call queue in noise.
Projections Tab
Projection alerts fire on two dimensions: how far behind the high-water-mark a projection is, and how long since it last advanced (stale detection). A third toggle controls auto-restart on stale.
Global Defaults
| Section | Threshold |
|---|---|
| Behind High Water Mark (events) | Warning · Critical |
| Stale Detection (seconds) | Warning · Critical |
| Auto-Restart | On / Off |
"Behind" is the difference between the projection's current sequence and the event store's current high-water mark. "Stale" is the wall-clock interval since the projection last advanced.
Auto-restart, when enabled, sends RestartProjection to the affected service when a projection trips the Critical stale threshold. It will only restart once per stale episode — repeated stalls require operator attention.
Per-Service Overrides
Same pattern as the Metrics tab — pick a service, set overrides, see Inherited / Overridden tags.
Per-Shard Overrides
The most granular knob. Enter ServiceName:ShardName (e.g. OrderService:OrderProjection:All) to override thresholds and auto-restart for one shard.
Per-shard configuration also has a suppress switch that silences alerts entirely for that shard — useful for the rebuild scenario where a shard is intentionally far behind for the duration of a rewind, or for a known-broken shard that's being investigated.
History Tab
A read-only audit trail of every threshold change.
| Column | Meaning |
|---|---|
| Time | When the change was saved |
| Config Area | Which section was edited (e.g. MetricsDefaults, ProjectionService:OrderService) |
| Field | Specific field name |
| Previous | Old value (red) |
| New | New value (green) |
Use this to answer "who lowered the failure-rate Critical threshold last week?" and "did the projection-stale defaults change since the last quiet weekend?" The Refresh button re-fetches; the table is not auto-refreshed because edits are infrequent.
History is independent from the system-wide Audit Log — it tracks configuration changes specifically, not operator actions on services.
Hysteresis and Alert Lifecycle
CritterWatch alerts are event-sourced: they go through Raised → Elevated → Reduced → Resolved → Cleared. The Critical / Warning thresholds drive Raise and Elevate transitions; Resolved fires when the metric drops back below Warning; Cleared is operator-initiated.
Hysteresis prevents flapping at the boundary — once an alert is Raised, the metric must drop noticeably below the trigger before it Resolves. The hysteresis margin is built into the alert engine and is not currently surfaced as a user-tunable; this section will gain a control when the engine exposes it.
Tips
- Tune the preview, save once. The preview is the right place to iterate. Saving each tweak fills the History tab with low-signal entries.
- Per-service overrides win over global defaults. Per-message-type overrides win over per-service. Per-shard wins over per-service. There's no per-tenant layer today.
- A blank field is "inherit," not "zero." Setting a threshold to 0 means zero is the trigger. To remove an override entirely, clear the field — the inherited-tag should reappear.
- Use baselines, not absolute numbers. Absolute thresholds drift as load patterns change; baseline-relative thresholds adapt.