Services
The Services view lists every Wolverine service that has registered with CritterWatch. From here you drill into a single service's detail page, which is the operational hub for one logical Wolverine application — its nodes, its agents, its message handlers, its endpoints, its tenants, its DDL, and the rest.
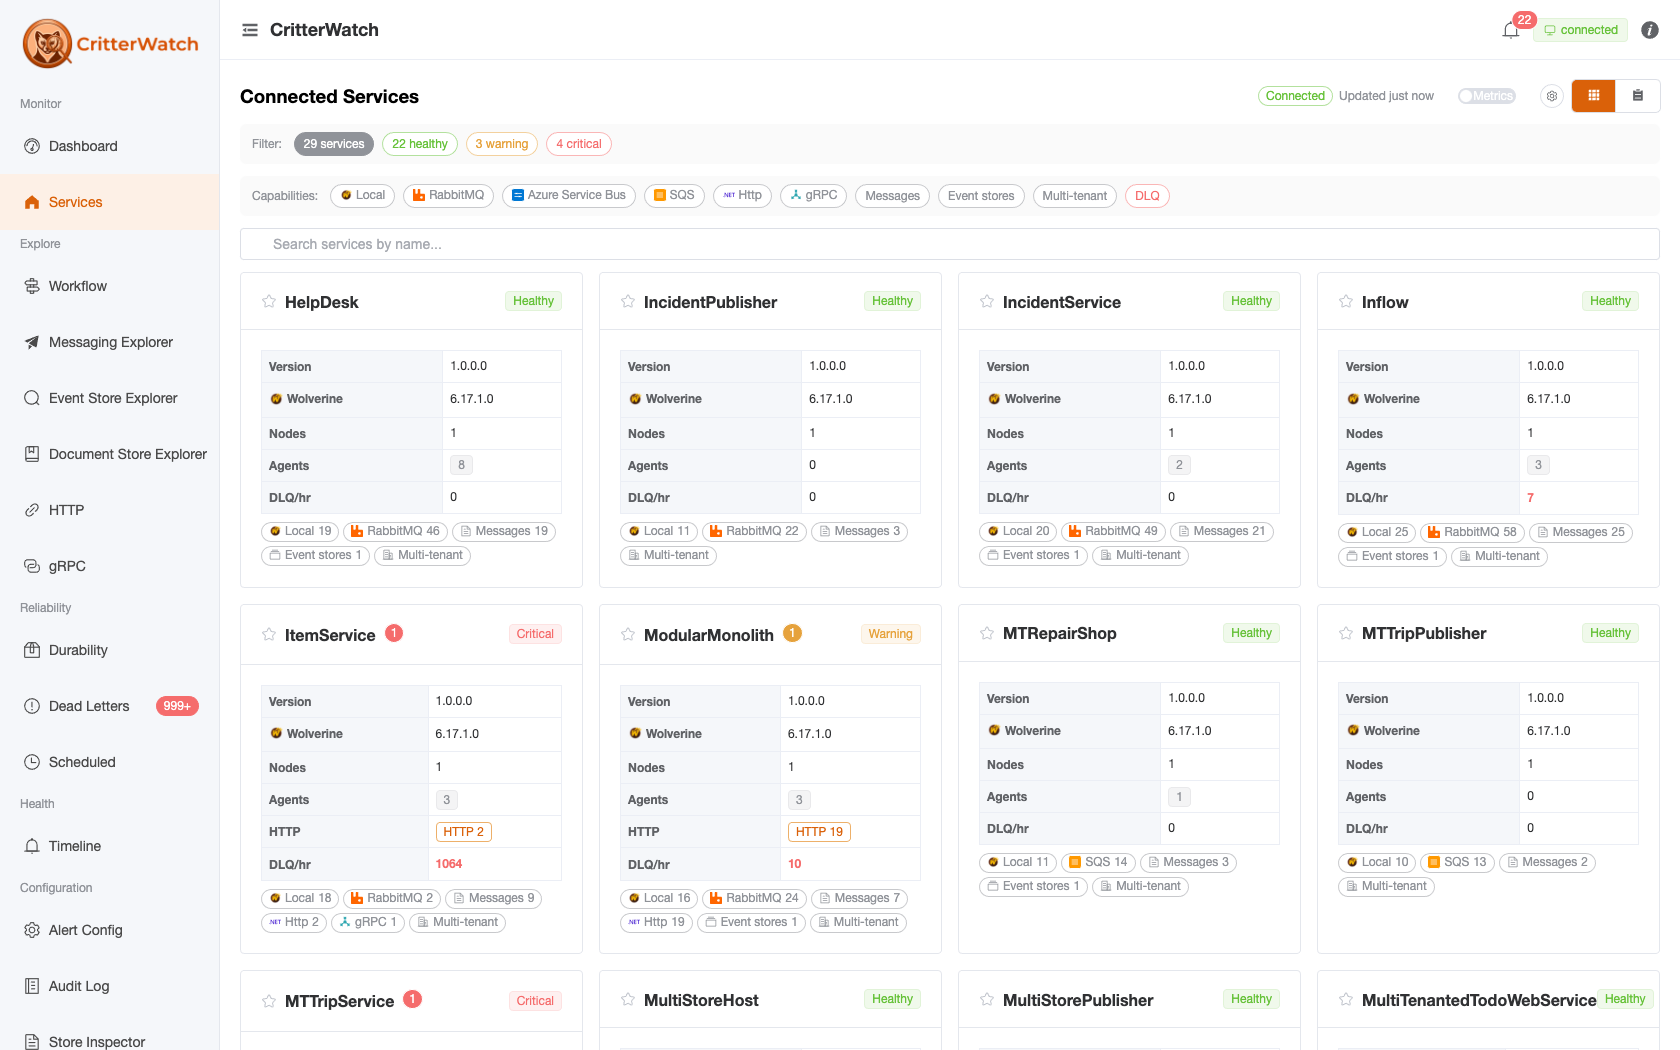
Services List
The list page renders both as a card grid (default) and as a sortable table. Use the toggle in the toolbar to switch.
Each card / row shows:
| Field | Meaning |
|---|---|
| Name | Wolverine ServiceName — unique within the cluster |
| Label | Human-readable display name; defaults to the service name and is editable on the service's Overview tab |
| Version | Wolverine version reported on the most recent VersionDetected snapshot |
| Status | Aggregate health roll-up — Healthy / Warning / Critical / Unknown |
| Nodes | Active process instances heartbeating in the cluster |
| Msgs/hr | Recent throughput across all handlers and endpoints |
| DLQ | Unresolved dead letters in this service's stores |
| Alerts | Open alerts (raised + elevated) attributed to this service |
Clicking a service opens its detail page. The detail page binds the active tab to the URL via ?tab=<name> so deep links and back-button navigation always land on the right pane.
Service Detail
The detail page is organised into five always-on tabs and three conditional tabs. The conditional tabs are only rendered when the service surfaces the relevant capability.
Overview · Event Store · Durability · Cluster · Health & Metrics · [HTTP] · [Tenants] · [Sagas]- HTTP appears when the service exposes an ASP.NET / gRPC surface.
- Tenants appears for any multi-tenancy mode.
- Sagas appears when the service hosts at least one saga.
Where did the old tabs go? The per-service Messaging and Documents tabs were retired — messaging now lives in the fleet-wide Messaging Explorer and documents in the Document Store Explorer, both reachable from the Overview capability cards (below). The old Storage tab was renamed Event Store, its message-store table moved to Durability, and brokers moved to the Overview Brokers card. The standalone Metrics tab merged into Health & Metrics (alerts first, then the metrics table).
URL backward compatibility
The reorganisations keep old URLs working so saved bookmarks don't 404:
Old ?tab= | Lands on |
|---|---|
?tab=messages / ?tab=messaging | Overview (the Messaging tab is retired) |
?tab=documents | Overview (the Documents tab is retired) |
?tab=nodes | Cluster tab, Nodes view |
?tab=agents | Cluster tab, Agents view |
If a service has any critical alerts and no explicit ?tab= is set, the detail page opens on Health & Metrics (whose first section is Alerts) so the operator sees the active incident first.
Overview Tab
The Overview pane is the at-a-glance identity card for the service. It is the only tab that always opens, and it is the home for editable service-level configuration.
Mini metrics dashboard
Five compact cards across the top:
| Card | Source |
|---|---|
| Msgs/hr | Total messages handled per hour (sent + received) |
| Avg Exec Time | Average handler execution time, milliseconds (excludes middleware) |
| Avg Effective Time | Average end-to-end processing time including middleware, serialization, and transport |
| DLQ/hr | Messages moved to the dead-letter queue per hour |
| Exceptions/hr | Handler exceptions per hour (includes retried + dead-lettered) |
Identity
A two-column descriptions table with:
Service ID — Wolverine
ServiceNameLabel — editable inline via the pencil-affordance
EditableLabelCell. Click the label, type a new value, press Return or click away to commit. The change emitsUpdateLabelNameand is reflected immediately across every page that shows this service.Version — Wolverine version
Communication URI — how CritterWatch talks back to the service (typically
wolverine.signalr://for the BFF transport)Tenancy —
None,Single,ConjoinedTenancy,DefaultTenant, orExtendedDynamic. The Tenants tab is shown for any tenancy mode beyondSingle/None; the per-row actions (Add / Disable / Enable / Remove / Hard delete) are only enabled when at least one event-store isDynamicMultiple.Tenant ID Style — surfaces Marten's
StoreOptions.TenantIdStylewhen the service has any tenancy. One of:CaseSensitive— tenant IDs stored exactly as supplied; case must match at session-open time.ForceLowerCase— tenant IDs silently lowercased on every reference.ForceUpperCase— tenant IDs silently uppercased on every reference.
When multiple document stores disagree the tag shows the first value with a
(mixed)suffix and a warning tooltip. Hidden when the service has no tenancy.
Health checks
A card on the Overview tab confirms whether this service is wired up to ASP.NET Core health checks. Two states:
- Registered (green) — the service is exposing its Wolverine state to anything that asks via the standard
/healthzendpoint, with the registered check names and tags listed as chips. This is what Kubernetes liveness and readiness probes consume. - Not registered (amber) — the service has no Wolverine-aware health check registered. Without one, k8s and load balancers can't tell whether the runtime is up or jammed.
The card is hidden entirely when the monitored service is running an older Wolverine.CritterWatch build that doesn't ship the registration descriptor.
For the why and how, see Health Checks. The "Operator docs" link in the card goes there directly.
Trace provider binding
A card on the Overview tab lets the operator pick which configured OTel store CritterWatch queries when looking up traces for this service's saga instances and handler runs. The dropdown lists every provider configured globally (Settings → Trace providers); leaving it empty falls back to the default. The "Manage providers" link opens Settings.
Capabilities at a glance
Below the identity table, a Capabilities panel renders one card per capability this service exposes — the launch pad from the service into the fleet-wide explorers, scoped to this service:
- HTTP / gRPC → the HTTP / gRPC explorer (
?service=) - Event store → the Event Store Explorer
- Documents → the Document Store Explorer (
/documents?service=) — this is where the retired per-service Documents tab now lives - Messaging → the Messaging Explorer (
/messaging?service=) — the retired Messaging tab's replacement - Brokers → the Messaging Explorer's Brokers view (
/messaging?service=&tab=brokers) — where the old Storage-tab Brokers section moved
On-page capabilities (EF Core, Durability, Cluster, Tenants, Sagas, Health & Metrics) switch the active tab instead of navigating away.
Evicting a service
The page header carries a danger-styled Evict button. Use it to remove a service that has been decommissioned (or is stuck registered) from CritterWatch — it clears the service's summary, alerts, metrics, and timeline and drops you back to the Dashboard. Eviction is "clear until it speaks again": if the service is in fact still alive, it re-registers on its next heartbeat, so this is safe to use on a service you think is gone. The button confirms via dialog and is disabled (with a tooltip) without an operations license.
Event Store Tab
The Event Store tab (its URL is still ?tab=storage) is the service-scoped event-sourcing summary. It holds the Event Model swim-lane (see Event Modeling) with an "Open in Event Store Explorer →" jump, the Event Stores cards, and the DbContexts section. Heavy stream/projection browsing lives in the global Event Store Explorer; document stores have their own Document Store Explorer.
Event Stores
Per-store cards listing registered projections and DDL. See DdlBlock for the syntax-highlighted DDL panel.
Moved (#641): the Message Stores persistence-count table and the Wolverine Configuration snapshot now live on the Durability tab (below). The standalone per-service Document Stores section was retired — reach document mappings through the Documents capability card → Document Store Explorer. Brokers moved to the Overview Brokers capability card → Messaging Explorer.
DbContexts
One card per EF Core DbContext registered in the service. Picked up automatically: contexts wired through AddDbContextWithWolverineIntegration get the full Wolverine-integrated picture, and any plain AddDbContext<>() registration is detected by the implicit-discovery hook in UseEntityFrameworkCoreTransactions, so untracked contexts still show up — just with the integration badges off.
Each card's title row carries a strip of badges. Read them in order:
- Wolverine — green when the model has been mapped through
MapWolverineEnvelopeStorage. This is the single most important badge to triage missing-publish issues. When green, your domain events publish atomically withSaveChangesAsyncbecause the envelope tables share the context's connection. When grey ("Plain"), Wolverine isn't driving this context's transaction at all — any messaging happens on a separate connection, which is correct but won't give you transactional outbox guarantees. - Tenancy —
Singlefor a single-database context (info color),ConnectionStringorDbDataSourcefor multi-tenant (warning color). Multi-tenant cards expand to show the per-tenant database list (server + database + tenantId only — never the raw connection string). - Tx —
Eager(green) when transactional middleware opens an explicit database transaction up front;Lightweight(amber) when atomicity is delegated toSaveChangesAsync. Absent when Wolverine isn't wrapping this handler in transactional middleware. - Domain events —
OutgoingDomainEvents(the per-handlerOutgoingDomainEventscollection is the source) orPerEntityType(one or more entity-level domain-event scrapers are registered). When PerEntityType, expand the card to see exactly which entity publishes which event type. - Outbox —
Mapped(green-path) means the envelope tables share this context's connection.ExternalConnectionmeans Wolverine's outbox factory is registered but the envelope tables live on a different connection — correct, but slower under load. Absent for plain contexts. - Wolverine-managed — present when the application is using
UseEntityFrameworkCoreWolverineManagedMigrations. Wolverine's resource-startup pipeline will create or migrate this context's database on its own. Without the badge, schema management is your responsibility (dotnet ef database updateor equivalent).
Below the badges, the Pending migrations field starts at "—" until you click Check pending migrations. The action is on-demand — clicking it runs IMigrator.GetPendingMigrationsAsync on the target service, opening a connection to the database and reading the __EFMigrationsHistory table. That's a synchronous round-trip per click, which is why we don't bake it into the regular capabilities snapshot. Inline error text appears under the field if the probe couldn't reach the database (transient connection failure, missing permissions, or a provider that doesn't support migrations).
Cards expand to a per-entity table — table name, primary-key columns, index count, foreign-key count, plus chips for sagas, owned types, and view-mapped entities. Saga rows cross-link to the Sagas tab so you can jump straight from "what does this context manage" to "what does this saga handle". Drill into an entity row for its full index and foreign-key detail.
Brokers
Moved (#641). Brokers are no longer on the service detail page. Reach them from the Overview Brokers capability card, which deep-links to the Messaging Explorer → Brokers view (
/messaging?service=&tab=brokers). The broker-health columns described below now render there, with the same meaning.
Configured messaging brokers (RabbitMQ, Kafka, Azure Service Bus, etc.) appear with each broker's declared queue / topic surface area.
Broker health columns
Each broker row carries a small health strip that surfaces the connection's actual condition rather than the configuration alone.
- Status — a traffic-light dot. Green when the connection is steady, orange when it has recently flapped (lost-and-recovered inside the last few minutes), red when it is currently down. Hover the dot for the probe's last description — typically the close-reason for an unhealthy connection or the recovery timestamp for a degraded one.
- Last successful — relative time since the most recent good probe (
2m ago,1h ago). Drift on this column is the leading indicator that something started failing in the background; if the row says "Healthy" butLast successfulis climbing past the probe cadence (60 s by default), the broker is flapping faster than the probe can resolve it. - Reconnects — running counter of times this transport has lost and re-established the broker connection since the host started. A single bump is harmless transient weather; sustained climbing is the signal something is actually broken — typically a misbehaving network path, an undersized broker, or expired credentials retrying. The counter renders bold-amber once it leaves zero.
- Cert expiry — the TLS certificate's expiry date when TLS is configured. The chip switches to amber within 14 days of expiry; the action is to rotate the cert before the broker starts refusing new connections.
A status of Unknown (grey dot, "—" for the timestamp) means the transport hasn't connected yet. That is normal during cold starts — the first probe pass runs ~60 s after the host comes up. If a row stays Unknown past the warm-up window, the transport is misconfigured or disabled; check the host's startup logs.
The same data is surfaced on the per-broker detail page (click the broker name) with extra room for the probe description and the reporting node number — useful when multiple nodes probe the same broker and you need to spot which one is seeing the issue.
Durability Tab
Live operator surface for the inbox/outbox tables backing this service. The tab was renamed from Reliability → Durability (#641) and is now the home of the Message Stores table and the Wolverine Configuration snapshot that used to sit on the old Storage tab.
The Message Stores table carries a row per store with live persistence counts:
| Column | Meaning |
|---|---|
| Icon | Postgres / SqlServer / RabbitMQ / etc. |
| URI | Database / store URI — click to drill in (see below) |
| Role | Main (durability tables) or Ancillary (DLQ-only or per-tenant overflow) |
| Incoming | Persisted incoming envelopes (inbox) |
| Outgoing | Persisted outgoing envelopes (outbox) |
| Scheduled | Persisted scheduled-send envelopes awaiting their delivery time |
| Handled | Successfully handled envelopes retained for idempotency (KeepAfterMessageHandling) |
| Dead Letter | DLQ count for this store. Click a non-zero count to drill into Dead Letters, pre-filtered to this store + service. |
The URI cell drills into a dedicated Per-message-store detail page at /service/:id/message-store/:storeUri — recent inbox/outbox samples, DLQ counts, scheduled-job queue, and the DDL for that store's durability tables.
The Wolverine Configuration snapshot below the table is reference data captured on each VersionDetected (once per deploy): Service Settings, Durability — Operational, Durability — Polling & Cadence, and Durability — Retention. Each field carries a tooltip pulled from the upstream Wolverine XML docs.
Use this tab when:
- A persistence count looks wrong and you need a per-store drill-in
- You want to see the actual DDL Wolverine has installed
- You need the per-store DLQ count without leaving the service page
The row backgrounds shade gold when an ?focus=<storeUri> query parameter is present — used by deep links from the alerts feed when a DLQ-rate alert fires.
Cluster Tab
The Cluster tab collapses the node-instance and agent-assignment lenses into a single tab with a segmented view-mode toggle. Both views are full operational surfaces — switching used to lose scroll, filter, and selection state, so they now sit side-by-side under one parent.
Cluster view toggle
A radio group at the top of the tab switches between:
- Nodes — process-instance lens
- Agents — agent-assignment lens
The active view is URL-bound via ?view=nodes|agents so deep links and operator bookmarks survive remounts.
Nodes view
Cluster-wide actions
| Action | Effect |
|---|---|
| Trigger Election | Force a new leader election. Disabled while OperationsEnabled is false. Confirmation popconfirm. |
| Clear Node History (overflow menu) | Trim the node-history table; retains the 10 most recent records |
The destructive Trigger Election is the primary action; Clear Node History is demoted to an overflow kebab so an operator can't fat-finger it next to the election button.
Node view-mode toggle
A second toggle inside the Nodes view switches between:
- Cards — one el-card per node with a Leader pill, alert badge, last health check, version, agents-assigned count, and Eject button
- List — dense table with the same surface area for big clusters
Heuristic auto-flips to List at 6+ nodes; an explicit operator override is URL-bound via ?nodeView=cards|list for share-and-restore.
Per-node columns / fields
| Field | Meaning |
|---|---|
| Heartbeat dot | Liveness pill — green / amber / red / grey. See Heartbeat dot below |
| Node # | Wolverine node number; clickable — drills into the per-node detail page |
| Role | Leader pill if this node holds the leadership lease |
| Alerts | Per-node active-alert badge — click to focus the alerts list filtered to that node |
| Version | Wolverine version on this node |
| Uptime | Time since started; tooltip shows the wall-clock start time |
| Last health check | Relative-time short-form; tooltip shows the absolute timestamp |
| Agents | Count of agents currently assigned to this node |
| Actions → Eject | EjectNode(nodeNumber) — danger popconfirm, redistributes assigned agents |
Heartbeat dot
Each running service sends a quick liveness ping to CritterWatch every 30 seconds. The dot beside every node number turns the dot through four states based on the gap since the last ping:
| Colour | State | Meaning | What to do |
|---|---|---|---|
| Green | Live | Heartbeat received within the last 60 s. | Nothing — the node is healthy. |
| Amber | Stale | At least one heartbeat missed (60–150 s old). | Watch for a few more seconds — a single missed beat usually means a slow GC or a brief network blip. |
| Red | Silent | Five or more heartbeats missed (older than 150 s, or never received). | Open the per-node detail page. The node has likely hung, lost its broker connection, or been killed without graceful shutdown. Check that the service process is up, the broker is reachable, and the network between them isn't partitioned. |
| Grey | Unknown | The node has only just started and no heartbeat has arrived yet, or the service hasn't been integrated with heartbeats. | Usually fine — older deployments that haven't been rebuilt against a heartbeat-aware Wolverine still show grey. If the node has been around for several minutes and stays grey, the service may need to be redeployed against the current Wolverine.CritterWatch package. |
Hovering the dot reveals the exact Last heartbeat: <timestamp> line plus a one-sentence description of the colour, so operators don't have to remember the rules.
The thresholds are sized against the default 30 s cadence (two missed beats turns the dot amber; five missed beats turns it red). Services that ship a slower or faster cadence — supplied via the heartbeatInterval parameter on AddCritterWatchMonitoring — still use the same wall-clock thresholds today; we'll revisit per-service scaling when a real deployment asks for it.
Agents view
Agent-assignment lens — every registered agent (projection shards, subscriptions, leadership, durability, scheduled-message agents, etc.) with its current node and status:
| Column | Meaning |
|---|---|
| Agent URI | Unique identifier (e.g. wolverine://leader/, marten://projection/TripSummary:All) |
| Status | Healthy / Degraded / Offline |
| Assigned Node | Which node currently owns this agent |
| Last Seen | Time of most recent health report |
Per-row actions:
| Action | Effect |
|---|---|
| Pin | PinAgentToNode — keep this agent on a chosen node across rebalances |
| Unpin | UnpinAgent — drop the assignment override |
If a deep link supplies ?scheme=<scheme> (e.g. from the Topology page), the agent table is pre-filtered to that scheme regardless of which view the URL landed on.
Health & Metrics Tab
The Health & Metrics tab (URL ?tab=metrics) carries the service's alert and metric story, and its label shows a critical/warning badge when alerts are active. Two sections:
- Alerts (first) — the active-alert timeline for this service with remediation actions, plus a focus chip when you arrive from an alert deep link.
- Metrics — the per-message-type metrics table (throughput, average execution + effective time, DLQ/hr, exceptions/hr), sortable for finding the hot path.
Retired tabs (#640). The per-service Messaging tab (the handler / message-type catalog) and the Endpoints tab (the listener + sender lifecycle grid) were removed from this page. Both now live in the fleet-wide Messaging Explorer, reachable from the Overview Messaging capability card:
- the message catalog → Messaging Explorer Messages tab (clicking a message type still opens the HandlerChainDetailPage);
- the listener/sender grid with its Pause / Drain / Restart and Edit controls → Endpoints.
Tenants Tab (conditional)
Visible whenever the service has any tenancy mode beyond Single / None. The tab renders one of two layouts depending on cardinality:
Dynamic case (DynamicMultiple)
Editable list — operators add / disable / enable / remove / hard-delete tenants at runtime via the relay commands. Top toolbar:
- Refresh — re-issues
RequestTenantListto the service - Add Tenant — opens the tenant-creation drawer (
AddTenantcommand)
Per-tenant columns:
| Column | Meaning |
|---|---|
| Tenant ID | Tenant identifier as the application sees it |
| Database URI | Per-tenant database connection string |
| Executions (1h) | How many handler executions this tenant generated in the last hour. Quick read on traffic volume per tenant. |
| Failures (1h) | How many handler failures (transient exceptions) this tenant hit in the last hour. Renders red when non-zero. |
| DLQ depth | How deep this tenant's dead-letter queue is right now. Renders red when non-zero. |
| Status | Active / Disabled |
| Actions | Disable / Enable (mutually exclusive) · Remove · Hard delete |
The three traffic columns only appear once at least one tenant is publishing per-tenant metrics. If you don't see them, your monitored service is either single-tenant or its Prometheus scrape isn't emitting tenant_id labels yet (turn that on in the service's Wolverine + OpenTelemetry config). The columns disappear again the moment no tenant has data — they don't sit there showing dashes.
When to drill in
Click any tenant row to expand it. The expand panel shows two cards:
- Top message types — the top five message types this tenant is processing, ranked by execution count, with per-type failure and DLQ counts. Use this to answer "which handler is the noisy tenant hammering?" before paging the team that owns it.
- Durable counters — the full breakdown of this tenant's durable-store depth: incoming, scheduled, outgoing, handled, and dead-letter counts. Reach for this when the service-level Durability tab numbers look high and you want to know which tenant is parked in the inbox.
What "normal" looks like:
- Failures (1h) > 0 — single failures from a transient outage are normal; sustained non-zero across refreshes means the tenant is hitting a real bug or running with bad config.
- DLQ depth > 0 — anything above zero means messages are stuck. A tenant whose DLQ depth is climbing while the rest are flat is a classic noisy-neighbour signal.
- Executions (1h) far above the rest — usually fine on its own, but combine it with rising failures and you have a tenant that's about to start affecting the rest of the system.
Lifecycle
The full lifecycle a tenant goes through, from creation through permanent destruction:
- Register — the monitored service starts up with
MultiTenantedDatabasesWithMasterDatabaseTable(Marten) configured. CritterWatch sees theDynamicMultiplecardinality and renders the Tenants tab. - Add — operator clicks Add Tenant, supplies a tenant id + connection string. CritterWatch dispatches
AddTenant; the service writes a master-table row and (best-effort) creates the per-tenant database if it doesn't already exist. - Use — application code opens sessions against the new tenant id and reads/writes per-tenant data.
- Disable / Enable — soft toggles via
DisableTenantandEnableTenant. Disabled tenants stay in the master table but session-open against them throwsUnknownTenantIdExceptionuntil re-enabled. Useful for incident-time isolation without data loss. - Remove (
RemoveTenant) — drops only the master-table row. The per-tenant database is left intact for forensic recovery / backup. Reversible by re-runningAddTenantwith the same id + connection string. - Hard delete (
HardDeleteTenant) — drops the per-tenant database and removes the master row. Permanent; not reversible.
The end-to-end lifecycle is pinned by the multi_tenancy_lifecycle_end_to_end integration test so any UX change is forced to keep the underlying behaviour stable.
Tenant-id normalization (TenantIdStyle)
When the host sets StoreOptions.TenantIdStyle to ForceLowerCase or ForceUpperCase, both AddTenant and session-open run the supplied tenant id through MaybeCorrectTenantId before doing anything with it. Concrete consequence:
| Configured | AddTenant("Acme-Corp", …) writes | martenStore.LightweightSession("Acme-Corp") resolves to |
|---|---|---|
CaseSensitive (default) | Acme-Corp | the Acme-Corp tenant DB (or fails if you only added acme-corp) |
ForceLowerCase | acme-corp | the acme-corp tenant DB |
ForceUpperCase | ACME-CORP | the ACME-CORP tenant DB |
The normalization is silent — the operator's typed id is rewritten without a warning. The UI uses this contract to inline-warn before the command leaves the browser. Under ForceLowerCase / ForceUpperCase, you cannot have two tenants whose ids differ only in case (the second AddTenant collides with the first).
Actions
| Action | Effect |
|---|---|
| Disable | DisableTenant(tenantId) — soft-disables; messages routed to the tenant queue without dropping data |
| Enable | EnableTenant(tenantId) — re-enables a disabled tenant |
| Remove | RemoveTenant(tenantId) — drops the master-table record only; the per-tenant database itself is not deleted |
| Hard delete | HardDeleteTenant(tenantId) — drops the tenant database and removes the master record. Permanent. |
See Wolverine.CritterWatch / Inbound commands for the full command reference.
Static / sharded case (StaticMultiple) — read-only
Tenant lists configured at startup show as a read-only table. The Add Tenant button is absent and per-row actions render as a "Read-only" hint with the tooltip "This service uses static tenancy; tenants are configured at startup, not at runtime." Source: eventStores[*].database.databases[*].tenantIds, flattened and de-duplicated by tenant id; each row carries the DatabaseDescriptor.identifier (or databaseName) so operators see which DB the tenant routes to.
Add Tenant dialog — TenantIdStyle validation
The Tenant ID input runs through the resolved TenantIdStyle policy client-side (mirroring JasperFx.MultiTenancy.TenantIdStyleExtensions.MaybeCorrectTenantId):
- Empty / whitespace-only input is rejected (the Add button stays disabled).
- When the input would be silently rewritten under
ForceLowerCase/ForceUpperCase(e.g.Acme-Corp→acme-corpunderForceLowerCase), an inline warning appears under the input. The Add button stays enabled — the operator can knowingly proceed; the warning surfaces the policy rather than enforcing a different one. - Under
CaseSensitiveno warning is shown; the id is stored exactly as supplied.
Hard-delete typed-id confirmation
Hard delete is gated behind a typed-tenant-id confirmation modal:
The standard "are you sure?" double-confirm is not enough friction for a database-drop. The operator must type the exact tenant id; only then does the dialog's primary action button enable. Audit log records every hard delete with the operator's identity (see Audit Log).
HTTP Tab (conditional)
Only rendered when the service surfaces any HTTP endpoint — either a Wolverine HTTP graph (Wolverine.HTTP is referenced), or non-Wolverine ASP.NET Core endpoints when the host opts in via services.AddCritterWatchHttp().
The tab is one merged surface — Wolverine HTTP chains and non-Wolverine endpoints share the same table with a Source chip per row. A filter strip above the table lets you narrow by source.
All Endpoints
| Column | Meaning |
|---|---|
| Source | Wolverine / MinimalApi / Mvc / RazorPages / SignalR / Other — color-coded chip |
| Method | GET / POST / PUT / DELETE / PATCH / OPTIONS — color-coded tag |
| Route | Route pattern. Multi-version Wolverine chains show one row with a chip per declared version (v1 / v2 / 2024-01-01) |
| Handler | Generated handler endpoint or display name (monospace) |
Click any row to drill into the per-endpoint detail page. Wolverine chains route to the HTTP chain detail page; non-Wolverine endpoints route to the ASP.NET endpoint detail page.
Above the table, source chips work as a multi-select filter; toggle the ones you care about. The free-text input on the right matches anywhere in the route, method set, or handler name.
A configuration block follows with the Wolverine HTTP graph's settings — global route prefix, antiforgery defaults, applied policies, middleware types, tenant-detection strategies. Tooltip per field, sourced from XML doc comments.
Coming soon: when a route fires a downstream message, you'll see chips on the row pointing at the Messaging-tab page for that message type. The Wolverine HTTP graph surfaces cascading messages on the chain detail page today; the row-level chip is the next step.
Detail-page drill-ins
Several tabs feed into dedicated detail pages with their own routes. Each is breadcrumb-anchored back to the parent service.
Per-node detail page
Route: /service/:id/node/:nodeNumber
Drilled into from the Cluster tab → Nodes view (clicking the node number cell in either Cards or List view). Surfaces:
- Node identity: number, version, started time, last health-check timestamp
- Heartbeat history graph
- Agents currently assigned to this node, with un-assign / pin controls
- Per-node alert list filtered to this node
- Eject control
Per-message-store detail page
Route: /service/:id/message-store/:storeUri
Drilled into from the Durability tab → message-store row click. Surfaces:
- Persistence counts (incoming, outgoing, scheduled, handled, DLQ)
- Recent inbox / outbox samples
- The actual installed DDL for that store's durability tables (rendered through
DdlBlock) - DLQ drill-in pre-filtered to this store
Endpoint detail page
Route: /service/:id/endpoint/:endpointUri
Drilled into from the Endpoints tab. Surfaces:
- Endpoint identity (URI, mode, transport)
- Live metrics (sent / received / failed / DLQ)
- Circuit-breaker + buffering settings (read-only — edit happens on the parent tab)
- Recent message samples
- The handler source code if the endpoint terminates in a handler
Handler chain detail page
Route: /service/:id/handler/:messageType
Drilled into from the Messaging tab. Surfaces:
- Message type identity (full type name, namespace)
- Middleware chain (in order)
- Generated handler source code with syntax highlighting
- Per-endpoint sticky-routing metadata
- Recent metric trend
Saga detail page
Route: /service/:id/saga/:stateType
For sagas declared in the service. Surfaces saga state shape, configured timeouts, retry policy, and a link to Saga Instances for active state rows.
Saga instances page
Route: /service/:id/saga/:stateType/instances
Live list of in-flight saga instances. Per-row: instance id, state, last update, message log.
Subscription / Projection / Broker detail pages
Subscription detail: /service/:id/subscription/:name Projection detail: /service/:id/projection/:shardName Broker detail: /service/:id/broker/:broker
Each surfaces the same shape — identity, config snapshot, recent activity, lifecycle controls (rewind, rebuild, restart). See the linked tabs for full coverage:
- Projections — Projections
- Subscriptions — Cluster tab → Agents view
- Brokers — Overview Brokers card → Messaging Explorer
DDL viewer
A few tabs render PostgreSQL DDL through the shared DdlBlock component. It uses highlight.js with the SQL grammar, light + dark themes, and a copy-to-clipboard affordance. Used on the Event Store tab (Event Stores) and the per-message-store detail page.
Operations gating
Every action on the detail page that mutates state — Evict service, Pin / Unpin, Eject Node, Add / Remove / Hard-delete Tenant, Trigger Election, projection rewind / rebuild / restart, and edits — is gated by the global "Operations enabled" flag. (Listener Pause / Drain / Restart moved to the Endpoints grid in the Messaging Explorer and is gated there.) When disabled, the buttons render disabled with a hover tooltip explaining why. This is set in Settings → Connection settings, and is the recommended way to switch CritterWatch into a read-only mode for production.