
Activity Timeline & Audit Log
The Activity Timeline is a real-time chronological feed of every notable event across all monitored services. It serves as both an operational timeline — showing what is happening right now — and an audit log — recording what happened in the past, including all operator actions.
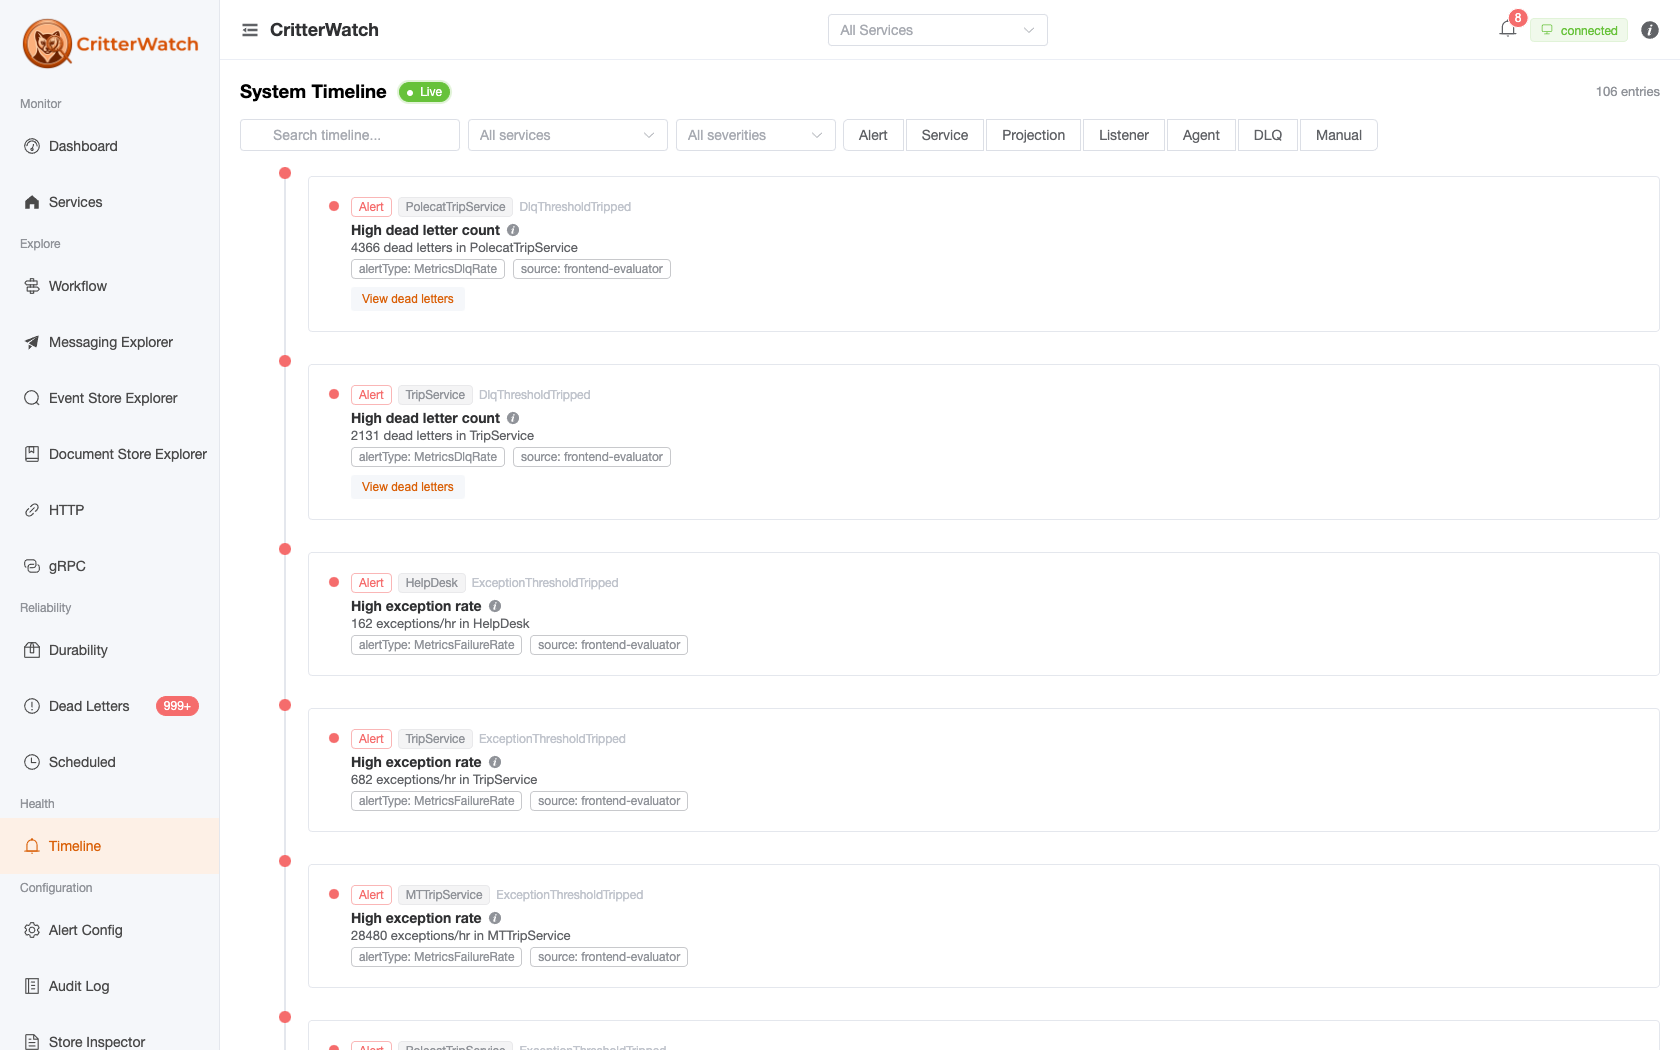
Timeline Feed
The timeline shows entries in reverse-chronological order (newest first). Each entry shows:
- Timestamp — when the event occurred
- Service — which monitored service the event came from
- Category — the type of event (see categories below)
- Severity — Info, Warning, or Critical
- Description — human-readable summary of what happened
New entries stream in via SignalR in real time. The feed automatically scrolls to new entries unless you have scrolled up to review historical items.
Event Categories
Every timeline entry carries exactly one of seven categories, and the filter chips on the page are exactly this set. The categories below are what TimelineProjection writes; anything not listed here is not a timeline entry, whatever else the product records about it.
Service
- Service registered (first time seen)
- New version detected
- Capability manifest changed (first recorded, refreshed unchanged, or surface changed)
Node
- Node added (new process instance started)
- Node removed (process stopped cleanly)
- Dormant node ejected
- Node flapping (a coalesced summary standing in for a burst of join/leave churn)
Agent
- Agent started on a node
- Agent stopped
- Leadership assumed (new leader elected)
- Leadership lost (node stepped down)
Projection
- Projection auto-restarted (health-driven recovery — a warning)
- Operator actions: rebuild started / finished, paused, restarted, rewound, orphaned shard ejected
- Apply error and dead letter recorded (warnings)
Listener
- Operator actions on a receiving endpoint: paused (a warning — consumption stops app-wide until resumed), resumed, drained
Alert
- Alert raised / elevated / resolved / cleared
AlertReduced is a real alert lifecycle event but has no TimelineProjection transform, so a severity reduction does not appear here. Acknowledging or snoozing an alert is an operator action rather than a lifecycle event and lands in the Audit Log instead.
Tenant
- Tenant added / disabled / enabled / removed
Compaction
- Stream compaction policy runs, one entry per tenant scope
A dry run is info — it reported and changed nothing. An armed run is warning, because it deleted events: compaction is irreversible and invisible from the read side, so this entry is the only lasting record that it happened. A run the store refused outright is a warning carrying the reason.
What is not on the timeline
Circuit-breaker trips, back pressure, and endpoint discovery raise alerts, so they reach the timeline only as Alert entries — there is no separate endpoint category.
Operator actions taken through the UI — DLQ replay and discard, scheduled-message edits and cancellations, node eject and election commands, alert acknowledge and snooze — are written to the Audit Log, a separate store with its own page and endpoint. They are not timeline entries and cannot be filtered to from this page.
Filtering
Filter the timeline by:
- Service — show only events from a specific service
- Category — one chip per category above; select any number to narrow the feed to them
- Severity — Info, Warning, Critical, or All
- Text search — filter by description content
Audit Log
The Audit Log answers a different question — "Who did what, and when?" — and it is a separate store, not a filtered view of the timeline. Audit entries are their own document type, written by their own writer, served by their own endpoint (GET /api/critterwatch/audit-log), and governed by their own retention story. See Audit Log for the full page.
Each audit log entry shows:
- Timestamp
- Action — what was done (e.g., "Replayed 12 dead letters of type BookTrip")
- Service — affected service
- Initiated by — who performed the action, resolved from the authenticated user when authentication is configured, or from the message envelope otherwise
There is no CSV export. For offline analysis, query GET /api/critterwatch/audit-log directly — it accepts optional ?service=, ?action= and ?targetUri= filters and a ?limit=.
Pagination
The timeline loads the most recent 100 entries. There is no date picker or time-range filter.
Timeline entries are pruned on their own schedule rather than living as long as the event store: the retention period defaults to 30 days (CritterWatch:Timeline:RetentionPeriod), swept hourly by the timeline-retention cluster singleton. Indefinite retention is available as an opt-out by setting the period to TimeSpan.Zero. There is also an opt-in per-service row cap (MaxEntriesPerService, off by default). The effective values are shown read-only on Settings › Data Retention.