
Endpoints
The Endpoints view shows every message endpoint across your monitored services — both inbound listeners (where messages are received) and outbound senders (where messages are published). It lives as a tab in the Messaging Explorer and as a standalone page at /endpoints (the old /listeners URL redirects here).
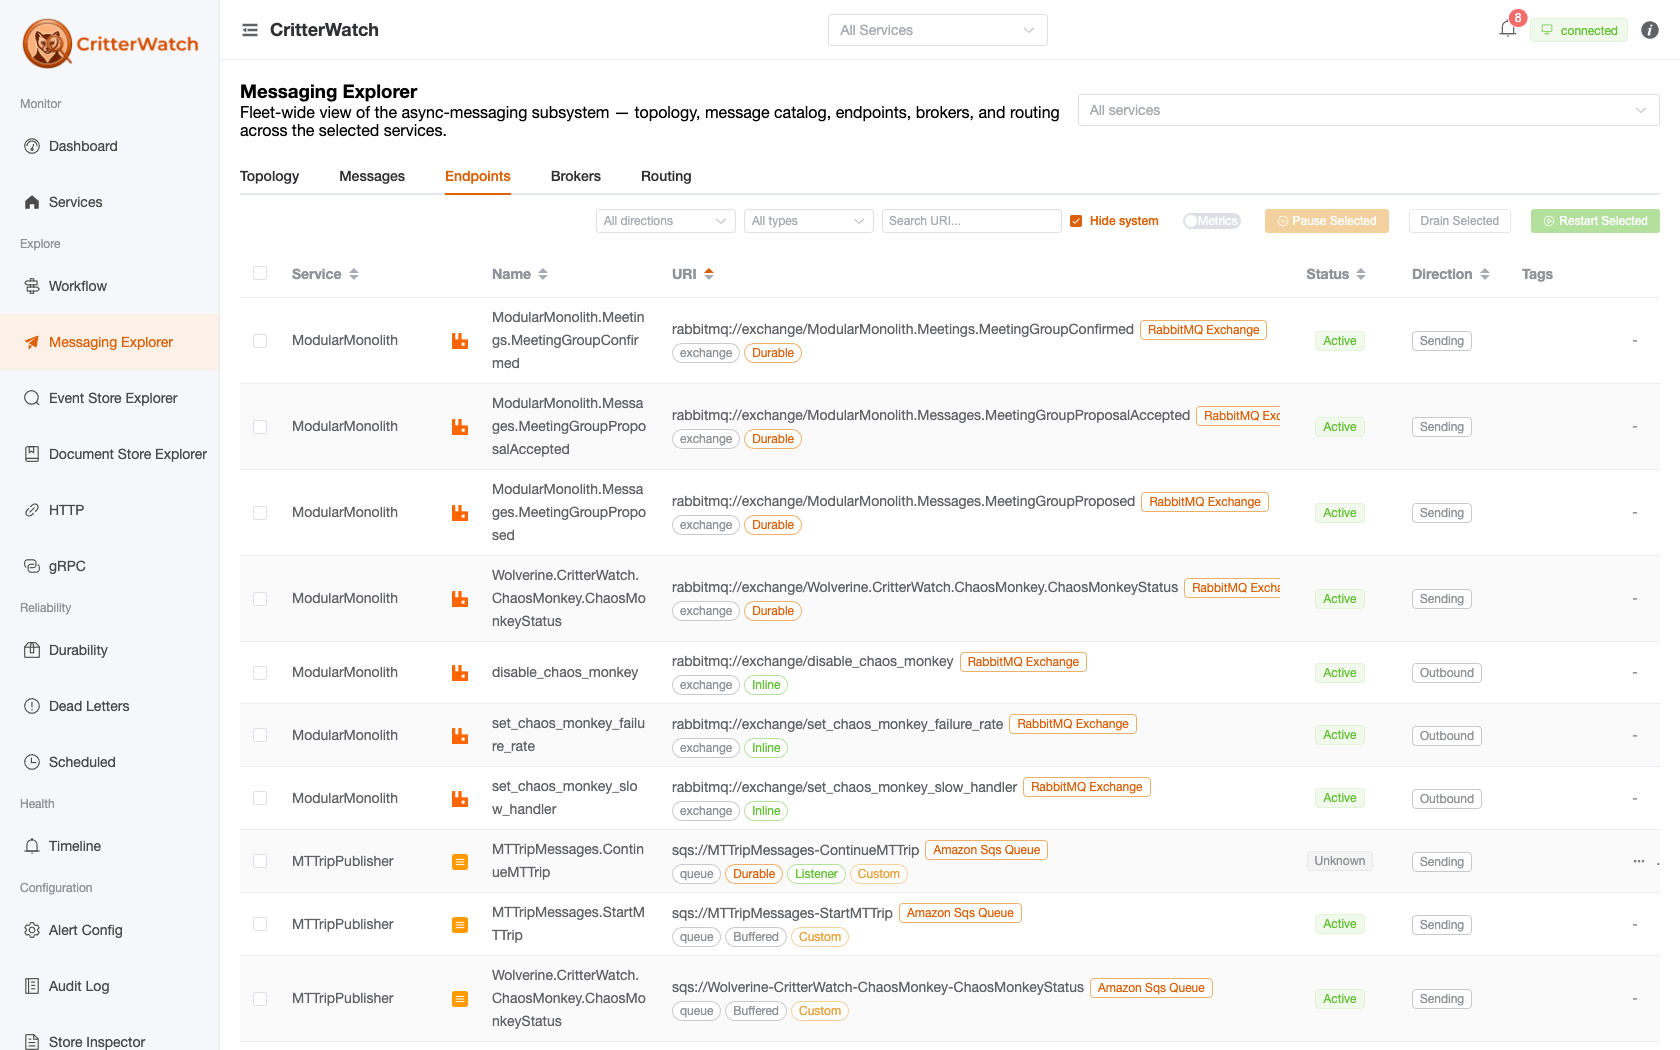
Endpoint grid
Each endpoint is a row. The grid leads with a selection checkbox (bulk actions operate on the rows you tick):
| Column | Description |
|---|---|
| Service | Owning service (shown in fleet/multi-service scope) |
| (icon) | Transport scheme icon |
| Name | Friendly endpoint name; falls back to the URI when the transport doesn't supply one (so exchange senders are no longer blank) |
| URI | The endpoint address, with a transport-type tag and a row of line-2 pills (broker role, mode, listener, system, interop, tags) |
| Status | Runtime status (see below), with small CB / BP icons when the circuit breaker has tripped or back pressure is active |
| Direction | Inbound / Outbound / Both / Local |
| Tags | Transport tag icons |
Six metrics columns — Msgs/hr, Sent/hr, Rcvd/hr, Avg Exec, DLQ/hr, Errors/hr — are hidden by default and revealed by the Metrics toggle in the toolbar (the preference is remembered). The grid also offers transport/scheme and direction facets, a URI search box, and a "hide system endpoints" toggle.
Status values
| Status | Meaning |
|---|---|
| Accepting | Listener is running and processing messages normally |
| Stopped | Listener has been paused by an operator |
| TooBusy | Back pressure is throttling this listener |
| Latched | Circuit breaker has tripped — paused due to repeated failures |
| Active / Latched | For senders (no listening status of their own): Active when the sender circuit is closed, Latched when it has tripped |
A listener can read Accepting while its transport channel is actually dead. When that happens, CritterWatch surfaces a dark health pill under the status — Disconnected (the channel dropped) or Faulted (the receive loop stopped) — so a silently-stuck listener is visible instead of looking healthy. An opt-in, rate-limited auto-kickstart can restart such a listener for you.
Two more pills read how full an accepting listener is. Both need a monitored service on Wolverine 6.32 or later, and both stay hidden while the listener is healthy:
- In flight N/L — an
InlineorNativeAcklistener is holding as many unacknowledged deliveries as its in-flight limit, normally the broker's prefetch window. It takes no more until a handler finishes. On these two modes the local buffer limit does nothing, so this is the ceiling that matters. A transport with no in-flight limit shows no pill rather than an invented one. - Hot partition — on a group-partitioned listener, one lane holds at least twice the average depth (and at least 10 messages). The listener's depth is the sum across lanes, so an even spread and a single stalled group read the same without this. Messages in one group run one at a time, so a slow or failing group backs up its whole lane. The exempt lane is left out of the average because it has its own parallelism.
Two more read a listener's in-memory idempotency guard, on Inline, Buffered and NativeAck listeners that have one configured. They need Wolverine 6.32 or later in the monitored service. Both count from when the service's process started, on that node, and show nothing until there is something to count:
- N duplicates dropped (information, not a fault) — redeliveries the guard recognised and did not run again. A number that keeps climbing means the broker is redelivering, usually because handlers run longer than the delivery timeout.
- Idempotency window shortened — the guard ran out of room for the ids it tracks and forgot some before the configured window elapsed. A redelivery arriving after that shortened window runs again. Raise
maxTrackedinWithInMemoryIdempotency(window, maxTracked)(the default is 100,000) until the pill stops appearing after a restart.
Endpoint controls
Lifecycle actions are bulk-only: tick one or more rows, then use the toolbar buttons. (Per-row Pause/Restart buttons were removed to reclaim column space.)
| Toolbar action | Effect |
|---|---|
| Pause Selected | Stop consuming on the selected listeners across the entire application, durably. Every node stops pulling, and the pause survives restarts + new nodes joining until you resume. Messages stay safely on the broker. |
| Drain Selected | Graceful shutdown — stop accepting new messages but let queued + in-flight work finish, then halt. The right call before a deploy. |
| Restart Selected | Resume paused or drained listeners across every node; the backlog that accumulated drains down. |
See the downstream-system-broken scenario for the full pause-and-resume workflow.
Pause All / Restart All apply to every endpoint in one service. They appear only on the standalone Endpoints page when a single service is selected and nothing is ticked — they're hidden inside the embedded Messaging Explorer tab.
Edit endpoint (per-row kebab)
Each row's actions live in a compact ⋮ kebab menu; its Edit item opens an Edit Endpoint drawer with two forms applied to the running endpoint without a restart:
- Buffering limits — Maximum (messages to buffer) and Restart Threshold.
- Circuit breaker — Failure Percentage Threshold and Pause Time (seconds).
Transport Type Icons
CritterWatch displays a transport icon alongside each endpoint URI to make it easy to identify at a glance:
- RabbitMQ (rabbit icon)
- SQL Server (database icon)
- In-memory (lightning bolt icon)
- Kafka (stream icon)
- Azure Service Bus (cloud icon)