
Message Topology
The Topology tab of the Messaging Explorer visualizes how messages flow between services in your Wolverine deployment. It answers: "Which services produce this message, and which services handle it?"
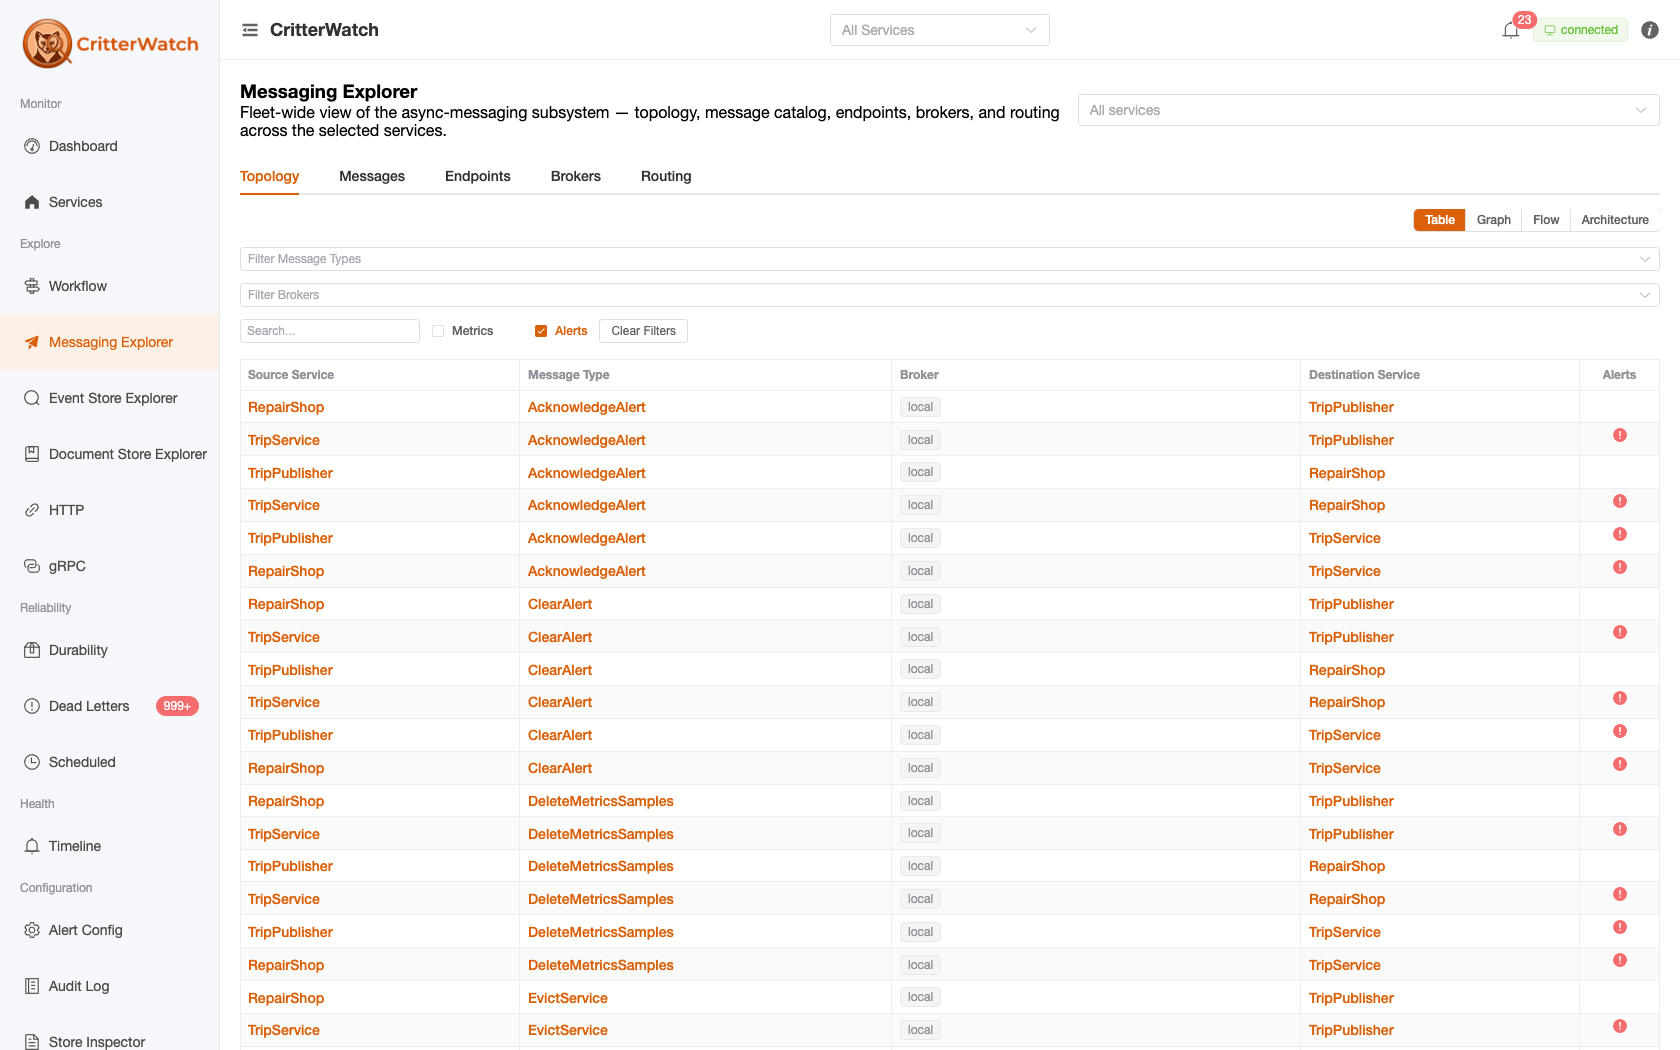
View modes
A toggle at the top switches between four renderings of the same data; Table is the default:
- Table — a sortable, filterable row-per-route list.
- Graph — a force-directed graph.
- Flow — a Sankey diagram where each flow's width is its throughput volume, so the heaviest paths stand out.
- Architecture — a layered, system-level view.
In the graph views, nodes are services (rendered as circles) and brokers (rendered as a white tile carrying the transport's tech icon — RabbitMQ, Kafka, Azure Service Bus, etc.). Message types ride on the edges between them, not as their own nodes. In the Table view, brokers likewise show as a tech icon next to the server name.
Message type detail
Clicking a message-type row (Table) or an edge/node (graphs) opens the Message Type Detail drawer. The Table rows and all graph views funnel into this one drawer, so the affordances below are reachable everywhere:
- View in Workflow — jump straight to the Workflow screen scoped to this type ("where does this fit?").
- Publishers (subscribing endpoints) — the services + endpoint URIs that publish this type; click a service to open it.
- Consumers (handlers) — the services and handler classes that consume it; View Handler Details opens the handler-chain detail page with the full generated source, middleware chain, and per-endpoint sticky routing.
- Causation Chain — the handlers that produce or consume this type, when it participates in a runtime-observed cascade.
The full generated source code for a handler lives on the handler-chain / message-type detail pages, not in this drawer. Reach it via View Handler Details or from the Messages catalog.
Causation chains
For messages published while handling another message, CritterWatch reconstructs the cascade from runtime-observed causation, e.g.:
BookTripCommand → [TripBookedEvent, PaymentRequestedEvent]
PaymentRequestedEvent → [PaymentProcessedEvent]
PaymentProcessedEvent → [TripConfirmedEvent, EmailNotificationQueued]
These links are discovered at runtime as messages are processed and reported back to CritterWatch.
Filtering
Filter the topology by:
- Service — show only connections involving a specific service
- Message Type — highlight a specific message type and its connections
- Brokers — show only messages flowing over specific brokers
Modular Monolith View
For modular monolith architectures where multiple handlers within the same process handle the same message type, CritterWatch displays "sticky handler" visualization — each handler appears as a distinct node even when they reside in the same service. This makes it immediately clear when one handler for a shared event is healthy while another is failing.