
Conversations
The Conversations screen answers a different question from Workflow. Workflow shows the static shape — where a type can flow. Conversations shows what actually happened to one concrete message instance: the real chain of sends, receives, and handler executions that one request set off across your services, drawn as a causal graph or a timeline.
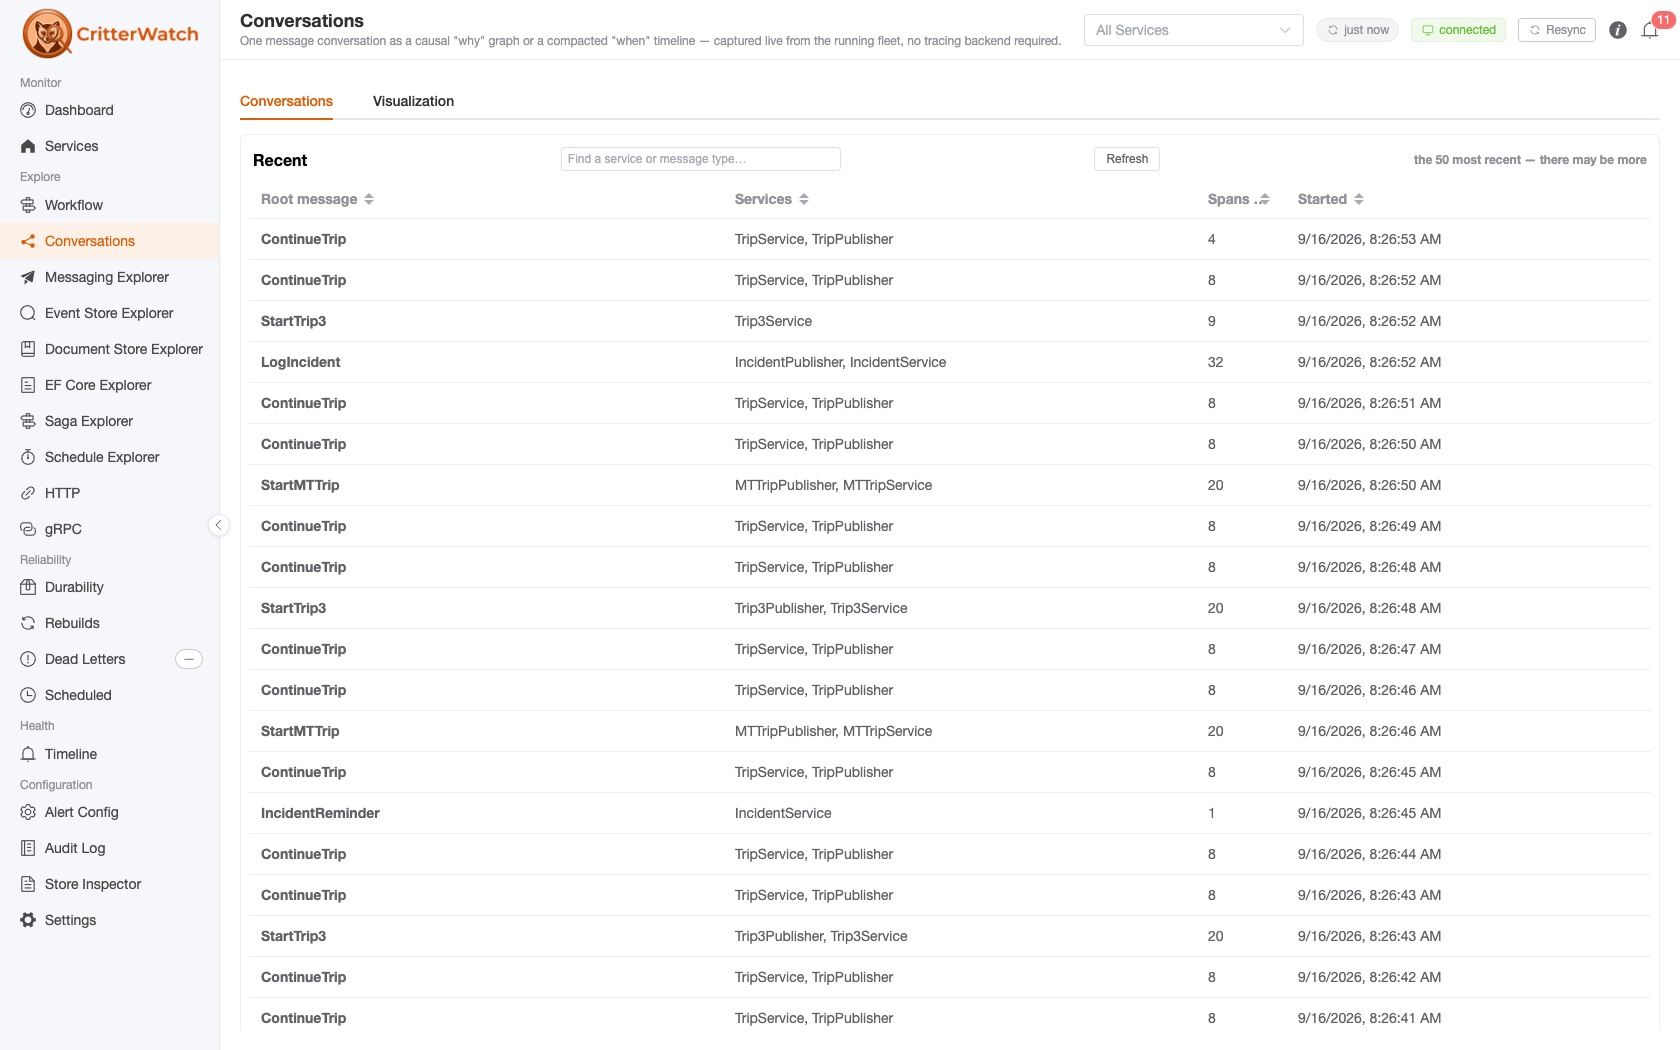
Reach it from the Explore → Conversations sidebar item (/conversations).
No tracing backend required. The feed is captured first-class from Wolverine's own
ActivitySourceinside each monitored service and pushed to CritterWatch. You do not need to bind an OpenTelemetry provider, run Jaeger, or configure anything — if a service is monitored, its conversations show up. Capture is bounded (a rolling retention window), so this is a live operational view, not a long-term trace archive.
Two tabs, each the full width
The screen is split into two tabs rather than two panes:
- Conversations — the list of what has been captured.
- Visualization — the selected conversation, drawn.
Both halves are wide things: the list carries service names that a narrow pane broke mid-word, and the causal graph is the widest artefact in the console. Clicking a row opens it on the Visualization tab; Back to the list returns. The Visualization tab names the conversation you came from — root message, services, spans, start — so a tab away from the list never loses track of what is on screen.
The Conversations tab
The list shows the most-recently-active conversations, newest first. Each row shows:
- Root message — the type that started the conversation (short name), or the method and route of the HTTP request that did, with a red failed tag if any message in it is still failed. A message that failed and then succeeded, on a retry or a replay, is not counted (see Failed or recovered).
- Services — every service the conversation touched.
- Spans — how many spans were captured. Not the same number as the message count the Visualization tab shows: one message produces a send, a receive and an execute span, so this is the larger figure. Hover the column header for the same note.
- Started — when the first span fired.
Sort by any column; the sort ranks the whole set, not the page you are looking at. Use the Find a service, message type, or any id… box to narrow the list, and Refresh to re-pull it. The list, and the conversation open on the Visualization tab, refresh themselves every 15 seconds, paused while the browser tab is hidden.
Finding a conversation
The find box is answered by the console, over every retained conversation, not over the 50 rows on screen, so a conversation older than those rows is found too. It takes:
- a service name or a message type, matched anywhere in the conversation (a substring, any case), not only the root message;
- a conversation id, a correlation id, a W3C trace id or a message id, matched exactly. A partial id finds nothing, because a fragment of hex would match unrelated conversations.
The header's service scopes the list as it does on the other explorers: pick a service there and only the conversations that touched it are listed, and the find applies within that. With neither, the list is the newest 50.
The same four ids open a conversation directly: /conversations?open=<id> accepts any of them, and so do get_conversation and cw-conversations, which share the lookup. The open conversation shows its trace id beside its correlation id, with a Copy button, to paste into a tracing tool. A conversation whose correlation id crossed a boundary no span crosses carries more than one, and shows each. When it was found by a trace id or a message id, the header says so.
The list is capped at the 50 most recent conversations (the 50 newest matches when you are finding), and says so beneath the grid when it is at the cap: "the 50 most recent — there may be more." Capture is a rolling window, so what is on this screen is what the console still holds — a live operational view, not an archive.
A conversation can age out between the list being read and the click. The Visualization tab then says it has aged out of the console's retention window, how old the list you clicked is, and offers Refresh the list. A conversation that ages out while it is open keeps its last capture, tagged no longer retained.
Reading one conversation — Why vs. When
The Visualization tab renders the selected conversation two ways, via the Why / When toggle:
Why — the causal graph
The default view is a causal "why" graph (ServiceInsight-style) on the same Vue Flow substrate the Workflow screen uses. Each box is a message envelope; caused-by arrows connect a message to the messages it triggered. A message that is still failed renders red; one that failed and then succeeded is marked ↻ instead (see below). A saga participant is badged. This is the view for "this request went wrong — what led to the failure, and what did it set off?"
When — the compacted timeline
The "when" timeline is a compacted, Temporal-style Gantt: one bar per envelope from start to finish, coloured by outcome, with the waits between bars shown as real gap markers. This is the view for "where did the time go?" — especially for flows with scheduled/delayed steps, where the gaps are the story.
Failed or recovered
A message is judged by its latest attempt. If that attempt failed, the message is failed: red in the Why graph and the When view, and counted by the list's failed tag. If an earlier attempt failed and a later one succeeded, a Wolverine retry or a replay from the dead-letter queue, the message is recovered: drawn normally with a quiet ↻, whose tooltip says it failed once and then succeeded. A recovered message offers no Replay or Discard, because there is nothing in the dead-letter queue to act on. Replay a failed message from here and, once the replay succeeds, the box turns from red to ↻ on the next refresh.
Recovering a failed message inline
On the Visualization tab, click a failed message's red box (Why view) or its row (When view). A small action bar appears offering Replay and Discard, for any message whose latest attempt failed (not a recovered one). The envelope's captured id is checked when you click: a box without one says so instead of acting. These reuse the exact same DlqOperation machinery as the Dead Letter Queue screen — the command travels the normal SignalR path, so recovering a poison message never leaves the conversation you're looking at. Each one asks for confirmation, is recorded in the Audit Log, and is followed on the Dead Letters page's Operations tab like any other replay or discard.
Going from a span to what it names
A span's pop-up links to the console's page for what the span ran, and each tag that names one links to it beside its value:
handler.typeandmessage.handlerto the handler chain, or on an HTTP span to the HTTP endpoint;http.routeandhttp.request.methodto the Wolverine HTTP endpoint with that route and method;rpc.serviceandrpc.methodto the gRPC method, when the service still registers it;messaging.message_typeto the message type, andmessaging.destinationto the endpoint;- the saga, stream and schedule tags to the saga instance, saga flow, event stream and schedule.
Event Model opens the service's Event Model focused on the slice for this span: an HTTP endpoint's slice, else the slice of the message type. The model is read when it opens, so a type that belongs to no slice opens the model unfocused.
The events a message appended
Wolverine writes the id of the message being handled to each event's causation_id, and the conversation's correlation id to its correlation_id, on Marten, Polecat and Fisher, with no tracing needed. Both columns are opt-in on the store.
- A span's pop-up links Events this message appended to the Event Store Explorer's By Filters or Tags on that message id, in the service owning the span. A link is a request, so the query runs. A send span has no such link: the service that sent a message did not handle it, so its store holds nothing by that id.
- The conversation header links Events in each service, on the correlation id. A conversation that crosses two services has two stores, and each is asked for itself.
- A span with a tenant reads that tenant. Otherwise the link reads every tenant of a conjoined store, and a store with a database per tenant asks for one.
- A service with more than one event store gets one link per store.
- A message that appended nothing answers Message … appended no events in …, which says where it looked. The id is the message's, not the attempt's, so every attempt of a message reads the same answer: a failed attempt's own events rolled back, and a later attempt's are there.
A store that does not capture the column gets no link. The pop-up and the header say so instead, and name the setting: Events.MetadataConfig.CausationIdEnabled and CorrelationIdEnabled on Marten, Events.EnableCausationId and EnableCorrelationId on Polecat and Fisher. Turning one on captures events from then on, so older events stay out of the answer. A service with no event store gets neither a link nor a note.
Cross-linking with the Workflow graph
Conversations and the Workflow flow graph are wired together in both directions:
- Show on workflow map — the button in a conversation's header opens the Workflow screen with this conversation's exact path lit across the static graph (everything off the path dims), so you can see the concrete run against the whole modelled shape.
- Coming the other way, clicking an edge on the Workflow flow graph opens a drawer of the real conversations that actually traversed it; each entry opens that conversation here, on the Visualization tab. Conversations follow messages, so an edge into an event lists the conversations through the message whose handler appended it, and says so; an edge into a projection or a read model explains that no conversation passes through it.
A span a saga's handler ran links to that Saga instance and to the Saga flow across its instances. The flow is drawn on the saga's page rather than here: one saga instance can span several conversations, joined only by its saga id.
How one conversation is stitched together
Conversations key on Wolverine's CorrelationId, and on the W3C trace id when there is none. Every message sent inside a handler or an HTTP endpoint carries the correlation id of what sent it, so a flow that stays in one trace is one conversation. Hops that share a correlation id across traces key as one conversation too. Where nothing captured links them, the link is drawn as an inferred, time-ordered dashed edge rather than asserted as fact — honest about what was observed versus what was reconstructed.
An HTTP request is the entry
A conversation begun by a Wolverine HTTP endpoint starts with a card for the request, labelled with its method and route, such as POST /orders/{id}. The endpoint's class is on the span's pop-up. The first message has an observed edge from the card when it was sent inside the request.
A card is kept only when a captured message names the request, so an endpoint that caused nothing adds nothing, however busy it is. Only Wolverine endpoints get one: Wolverine writes the route, the method and the handler to the request, and a route that is not a Wolverine endpoint has no handler to read.
No OpenTelemetry is needed. CritterWatch reads the activity ASP.NET Core already makes and samples nothing, so it pays for no span the host did not ask for, and a host whose logging is switched off entirely has no request to show.
A projection's side effects
A message a projection publishes from RaiseSideEffects joins the conversation of whatever appended the event, when the store captures correlation ids: Events.MetadataConfig.CorrelationIdEnabled on Marten, Events.EnableCorrelationId on Polecat and Fisher. slice.PublishMessage(message) carries the id all of the slice's events agree on.
- An async projection. The id crosses the daemon and a span does not, so the message is joined to the conversation by an inferred, dashed edge from whatever came before it. For an endpoint that appended an event and sent nothing, that is the request's card. The event and the projection sit in that gap and neither is drawn, so the conversation carries a notice saying so, and Events in on its header lists the events.
- An inline projection. The message is sent inside the request or handler, so its edge is observed and there is no gap to report.
Three things leave a side effect with less than that:
- The store does not capture correlation ids. The event has no id to carry, so the message takes the id of a context built for the whole daemon page: a new one, shared by everything that page published. The conversation starts at the published message, its request gets no card, and unrelated messages published from one page read as one conversation.
- The slice's events disagree, because the slice spans more than one flow. The message cannot say which event it came from, so it takes that same page id. Name the event yourself with
slice.PublishMessage(message, MessageMetadata.From(e)). - The request is not on the node that published. A card is held on the node that took the request, for a minute, until a message names it. If the projection ran on another node, or the daemon was over a minute behind, the conversation starts at the published message, and says what began it was not captured.
When a conversation says it is partial
A notice above the Why and When views says when something is missing from the conversation, and only then. It reads the same way as completeness does for an agent. Its notes say why:
- Part of this conversation is not linked to what caused it. A message was sent outside any handler or request. A projection's side effect reads like this, and so does a timer or a background loop, and nothing on the span tells them apart, so a publisher loop's conversations carry this notice too.
- Some of what began this conversation was not captured. A span names a parent the console does not have, or the first message carries the correlation id of a trace it holds nothing of.
- This conversation may be incomplete. Hops really may be missing: the read hit its limit, the conversation starts at the edge of retention, or a message was sent and never seen received.
A dashed edge on its own raises no notice. It is a link that was not captured, not a step that is missing.
When an edge is drawn as inferred
An edge is observed when the receiving span names the sending span as its parent. Wolverine carries that link on the envelope from whatever span is current when the message is sent, across every transport, durable inbox included. So a message sent from inside a handler, or from an HTTP endpoint, is drawn with an observed edge to what sent it.
A message sent with no current span starts a trace of its own, and every edge into it is inferred. That happens with a BackgroundService loop, a timer, or a side effect of an async projection. The dev fleet's sample publishers are loops of exactly this kind, which is why their conversations show dashed edges between the publisher's sends: those sends really are unrelated, apart from the correlation id the loop reuses. To give a background sender's messages a common parent, start an Activity around each unit of work before you publish, from an ActivitySource your tracing listens to. That span is not a Wolverine hop, so the conversation notes it as a parent the console never captured.
Store spans
On a host that exports a store's spans, a store span can sit between a message and what it caused. With Marten's TrackConnections on and a tracing exporter listening to Marten, the session's connection span stays current for the whole handler, so a cascaded message names it as its parent. The console reads through it: the edge stays observed, and the span pop-up lists what the store span says was written. On a service before Wolverine 6.61 the handler and saga tags land on that span too, and the console keeps them on the message. CritterWatch never turns tracking on and never makes a store span exist. It only keeps one that something else on the host asked for, so a host with no exporter sends none.
With an exporter on the store's source the daemon has a span as well, so a side effect of an async projection names it as its parent. The console never captures that span, so the conversation says so as a parent it does not have.
At most 8 store spans are kept per span of a message, as a part of that span. They take no place in the hop retention the console counts.
Asking an agent
Everything on this page is available to an AI agent through the console's own MCP server and CLI. Both are licence-gated like the rest of the console. The MCP tools also check their own capability, mcp.conversations.read, because a failed hop's status description is exception text; the CLI needs the license only:
list_conversationsis this page's list, narrowed by message type, service, failures only, or a start time.get_conversationopens one conversation by its conversation id or a correlation id. A correlation id from a failing test or a log line goes straight to the conversation behind it. It returns the hops, the Why graph's edges markedobservedorinferred, and the When view's per-envelope timing and gaps.cw-conversationsprints the same JSON from a shell.
An agent gets the same graph you see here, because the edges and timing are derived once and pinned to one fixture on both sides. It is also told when hops may be missing: completeness names a conversation that starts at the edge of retention, spans whose parent was never captured, envelopes sent but never seen received, and messages sent outside any handler or request. It counts inferred edges separately, as links that were not captured.