
Dashboard
The Dashboard is the first screen you see when opening CritterWatch. It provides a system-wide summary of all monitored services and surfaces critical issues that need immediate attention.
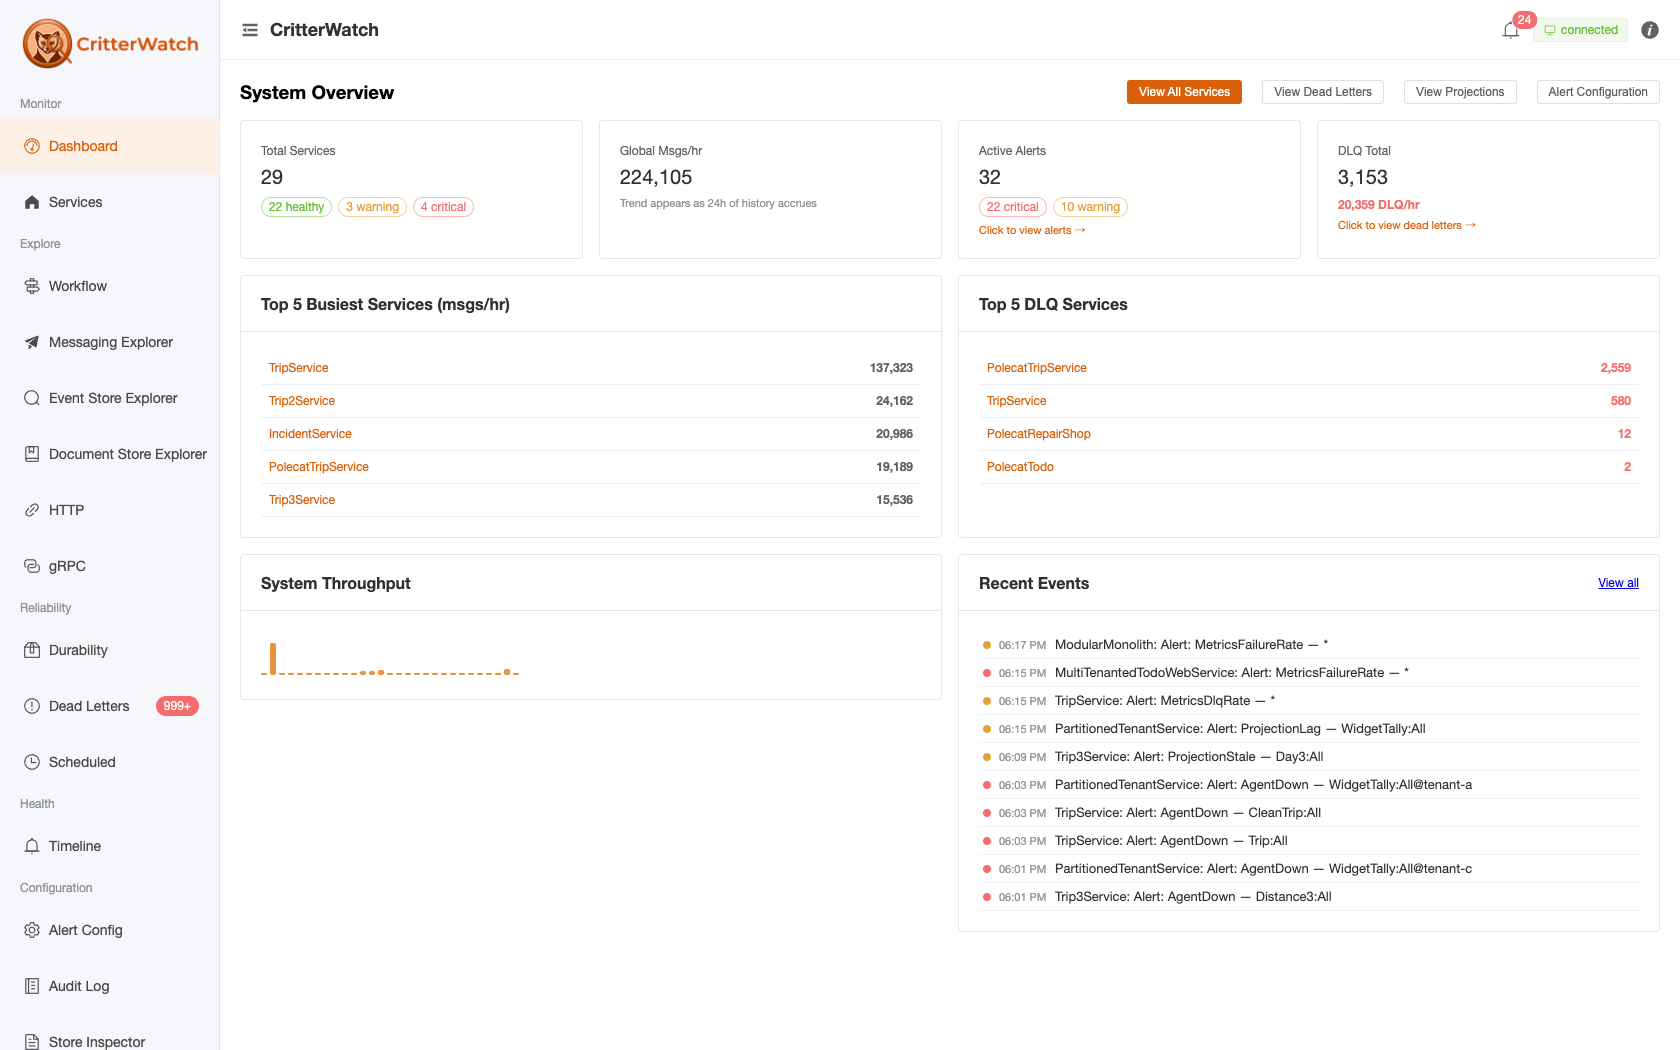
The page header reads System Overview. (Earlier builds carried a row of quick-action buttons here — View All Services, View Dead Letters, and so on — those were dropped as redundant; the sidebar covers the same jumps.) On a fresh install with nothing connected yet, the Dashboard shows a "No services connected yet" empty state with a get-started link.
Tip: every widget carries an ⓘ info icon next to its title. Hover it for a consistent explanation of what it measures, where the data comes from and its scope, how often it updates, and what clicking it does — so you never have to guess whether a number is a live rate or a running total.
Summary Cards
A row of four cards shows fleet-wide aggregates:
| Card | Description | Click target |
|---|---|---|
| Total Services | Number of connected services, with green/amber/red pills counting services by worst health status | The number → all Services; a pill → Services filtered to that health |
| Global Msgs/hr | Summed current throughput rate across all connected services — an instantaneous rate, not a 24-hour total. A sparkline beneath it plots the past 24h of throughput (it fills in as history accrues) | — |
| Active Alerts | Count of currently-firing alerts, split by severity (critical / warning) | The card → the Alerts page (a severity pill pre-filters) |
| DLQ Total | Estimated total unresolved dead-letter messages across all services, plus an estimated current DLQ/hr rate | The card → Dead Letters |
Cards with non-zero warning or critical values are highlighted to draw attention.
Top services + throughput
Below the cards, two tables call out the services that need attention:
- Top 5 Busiest Services — ranked by current messages/hour.
- Top 5 DLQ Services — ranked by unresolved dead letters.
A System Throughput sparkline (one bar per service) gives a quick visual of where the load sits. There is no per-service tile grid — use the Services list for the full roster, or click any row here to drill in.
Recent Events
A condensed view of the Timeline shows the 10 most-recent notable events — service registrations, node add/remove, projection lifecycle actions, and active alerts. The feed is filtered to an allow-list of operator-relevant event types (routine info chatter and resolved alerts are dropped). Click any entry to open the related detail; View all opens the full Timeline.
The feed is live: it is seeded from a one-shot load (plus any currently-active alerts) when the console first connects, and thereafter each new timeline entry is pushed over SignalR as timeline_entry_added, so node-join/leave and operator actions stream in without a page reload (#636).
Filtering
The global service filter is hidden on the Dashboard — it is a fleet-wide overview with no single-service context. To focus on one service, open it from the Services list.
Auto-Refresh
The Dashboard receives its data via SignalR; there is no manual refresh control. The summary cards and top-services tables update as service summaries arrive, DLQ counts re-query periodically, and the Recent Events feed streams new entries live (see above). The one non-live element is the Global Msgs/hr 24h sparkline, which reflects persisted throughput history and advances as each hour's bucket closes.