
Schedule Explorer
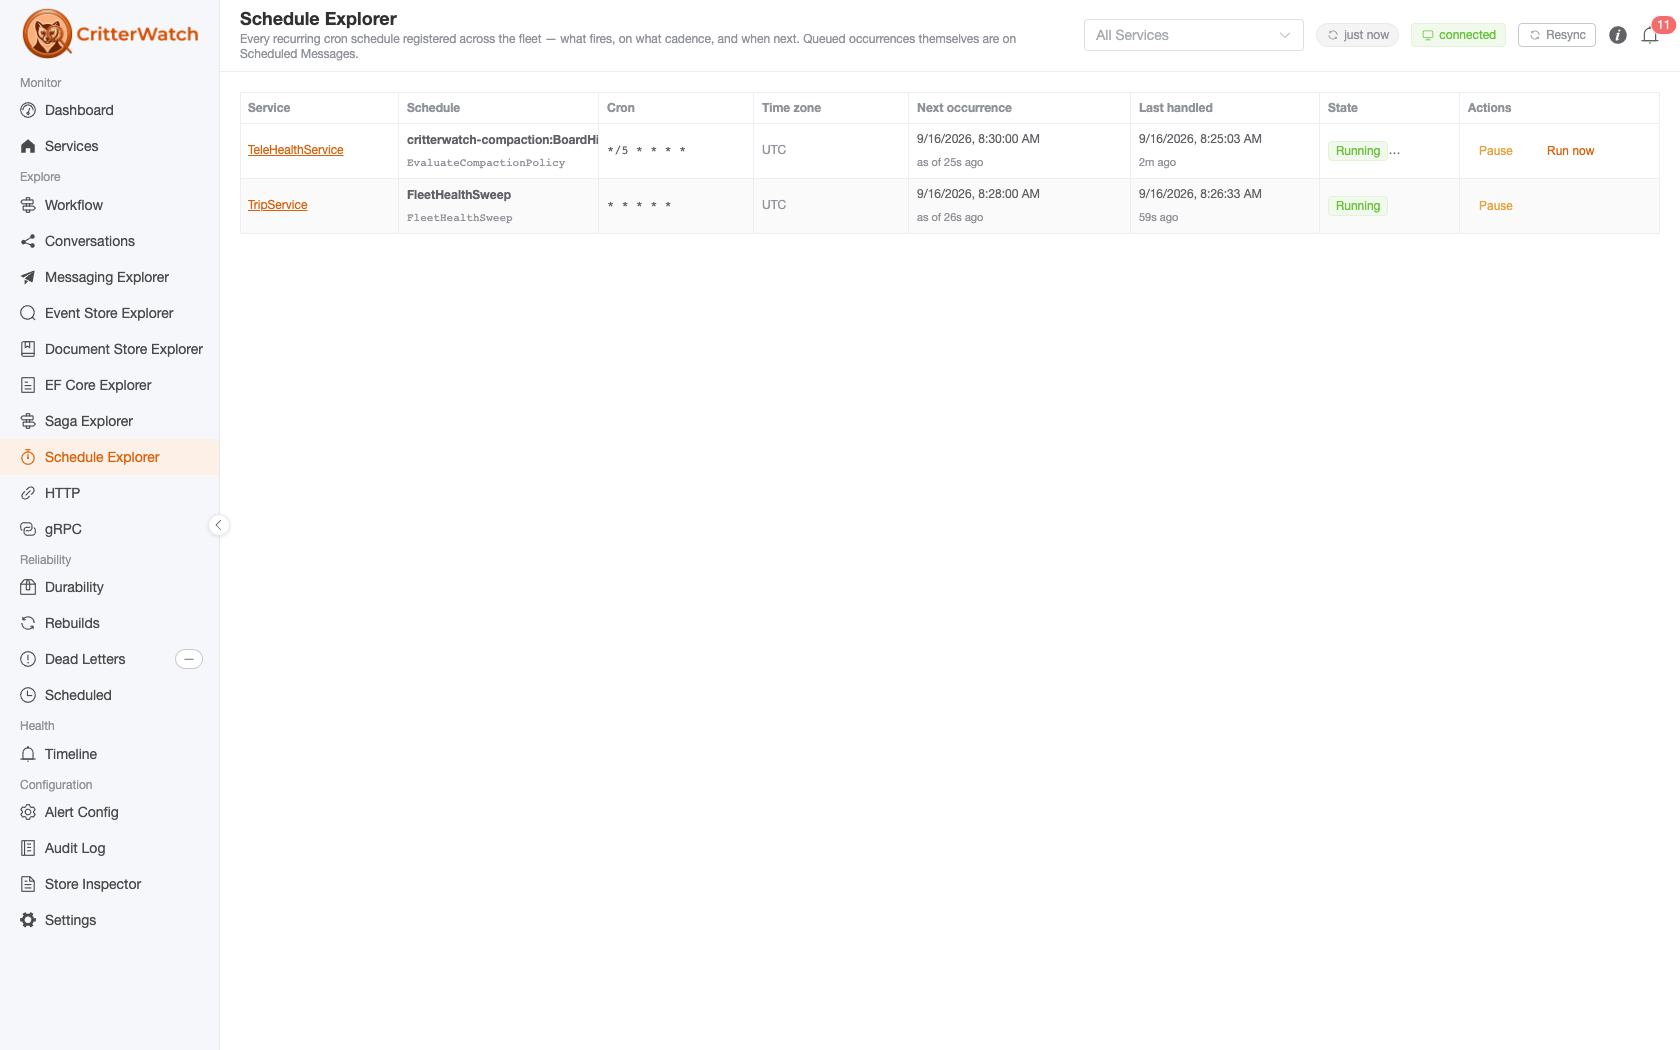
The Schedule Explorer is a fleet-wide catalog of the recurring cron schedules your services register through Wolverine 6.34's opts.Schedules.ScheduleRecurring<T>(...). One row per schedule per service: what fires, on what cron, in which time zone, and when it is next due.
Reach it from Explore → Schedule Explorer (/schedules). The global service selector in the header scopes it, and the scope rides the URL, so /schedules?service=TripService is a shareable deep link. Services that register no schedules never appear — which, for a fleet on anything older than Wolverine 6.34, is all of them.
Schedules, not their firings
This is not the Scheduled Messages page
The two pages answer different questions and it is worth knowing which one you want.
- Schedule Explorer — the schedule: "a
FleetHealthSweepruns every night at 02:00 Chicago time, and next fires at 02:00 tomorrow." - Scheduled Messages — the occurrences queued right now: the actual envelopes sitting in a service's durable inbox waiting to be delivered.
A schedule's pending next occurrence is an ordinary durable inbox row, so it has always been visible on the Scheduled Messages page — and cancellable and reschedulable there. What had no surface at all until 1.1 was the schedule itself. Cancelling one occurrence on that page does not stop the schedule; the next occurrence is computed and queued as normal.
The grid
| Column | Description |
|---|---|
| Service | The service that registered the schedule. Links to its detail page. |
| Schedule | The schedule's name, with the message type it publishes underneath |
| Cron | The schedule in plain language, which names any zone but UTC, with the cron expression under it. Hover the expression for the time zone occurrences are computed in; the schedule's own page lists it under Definition |
| Next occurrence | When the schedule next fires, in the display time zone, with the instant that reading was true underneath. A computed tag marks a schedule on Wolverine's timer path, which keeps no tracking row: the time is computed from the cron expression and time zone, not read from a stored fire time |
| Last handled | When a monitored node last actually ran an occurrence, and whether that run succeeded or failed with how long it took — see below |
| State | Active, Paused, Failing, Service down, or Never fires |
| Actions | Pause / Resume, Trigger now on an active schedule, and Run now on a compaction policy's row |
Reading a cron pattern
Every pattern carries a plain-language label, on the grid and on the schedule's own page, so */5 * * * * * reads Every 5 seconds and 0 23 * * 2 reads Every Tuesday at 11:00 PM. The pattern stays beside it: it is what the code says and what you will search for.
The time is wall-clock time in the schedule's own zone, and is never converted to yours. 0 23 * * 2 in America/Chicago is 11:00 PM Chicago all year and moves against UTC at each daylight saving change, so no single converted time would be true. A schedule in any zone but UTC says so in the label: Every Tuesday at 11:00 PM (America/Chicago).
The header's display time zone is a separate thing. It decides how an occurrence is shown, so Next occurrence is converted, while a schedule goes on firing in its own zone.
Some patterns show the pattern alone, because there is no reading the console can stand behind. It reads patterns as Wolverine does (Cronos: 5 fields, or 6 with leading seconds, including L, W, # and the @ macros), and leaves the label off rather than risk a wrong one:
| Pattern | Why it has no label |
|---|---|
A day of the month and a day of the week, such as 0 23 13 * 5 | Both have to match, so this is only ever Friday the 13th. The usual wording reads as every 13th and every Friday |
A step over the days of the week, such as 0 0 * * 1/2 | It runs over 0 to 7, so it fires Monday, Wednesday, Friday and Sunday, and "every 2 days" would be false |
Sunday written twice, such as 0 0 * * 0-7 | That is every day |
L-3W | A valid pattern with no plain-language form |
A label longer than the column is cut off at the cell's edge. Hover the cell for all of it.
Every runtime reading says when it was true
Underneath the next occurrence is one of three lines, and they are different claims:
| Line | What it means |
|---|---|
as of 40s ago | A live read of the service's own recurring tracking state. Its age is the age of the truth. |
announced 6h ago | The capability announcement's frozen copy. This service does not report live schedule state, so the age says nothing about the schedule — only how long ago the service registered. |
freshness unknown | The service reported no instant at all. There is no way to tell how old the values are. |
The distinction exists because the two used to be indistinguishable, and that cost a real diagnosis: a console showed a next occurrence four minutes in the past beside a schedule that was durably paused, with nothing on screen to suggest either number was old.
Why the announcement cannot carry it: a service re-announces its capabilities when their content hash changes, and the hash covers a schedule's definition fields only — name, cron expression, time zone, message type. The runtime fields ride along but do not contribute to the hash, because NextOccurrence advances on every cron tick: folding it in would turn a change-detection hash into a re-announce firehose, one full capability announcement per tick per service. So the announced copy is frozen at registration time and never catches up.
Instead each service pushes a small live read of its recurring tracking state on its own telemetry cadence, and a pause or resume you perform from this page is reconciled immediately from the service's acknowledgement. A service older than this console's release sends neither, which is exactly what the announced wording is there to tell you.
"Last handled" answers "is it still firing?"
This is the instant a monitored node last ran an occurrence of the schedule — an observed run, not the schedule's own bookkeeping. The two part company precisely when something is wrong: a schedule whose message has no subscribers keeps a moving next occurrence and never handles anything, and a service in an agentless durability mode has an announced schedule that is completely inert.
Empty is not the same as idle
An occurrence is handled wherever its message routed. If that is a different service, or a node whose report has not landed yet, or it happened before this console started watching, the column reads no data — which means not observed from here, never "this schedule is not firing".
It is also the handler's own clock, not the scheduled instant.
Pause and resume
Pause stops a schedule from firing without removing it; Resume starts it again. Both are relayed to the owning service, which applies them to its live recurring agent and acknowledges the result — the row shows a pending spinner until that acknowledgement lands, and every refusal path answers on the same channel, so a refused command never leaves a row spinning.
If nothing answers within 30 seconds, the row is released and a warning says so, naming the service, on whichever page you are on by then. That is no answer, not a failure: a command sent to a service that is down waits for it and applies when it returns, and the real outcome is reported if it lands later. Check the row before sending the command again.
A pause is only as durable as the service's tracking store
A service with the recurring tracking table records the pause durably and it survives a restart. A service without one applies the pause to its in-memory agent only: it is real, and it takes effect, but a redeploy or restart quietly undoes it.
The console does not present these as the same thing. The service reports which it did, and a non-durable pause is confirmed with an explicit warning saying so rather than a bare success.
Resuming does not backfill. Occurrences that would have fired while the schedule was paused are skipped, not replayed — the same rule Wolverine applies to occurrences missed while a service is down.
Per-schedule pause is not the same as pausing the agent — on the scheduled-message path. There, one wolverine-recurring:/// agent drives every schedule on the service, so pausing that agent stops them all, and the actions here target one schedule.
On the timer path the two are the same thing. Wolverine 6.52 runs each short-cadence schedule on its own wolverine-recurring-timer:///{name} agent, and pausing the schedule pauses that agent with an agent restriction. The schedule's row then reads Paused with no node running it, and the service's Agents view shows the same agent Assigned · Paused. Resuming either one clears both. The Cron column names the path (Timer or Scheduled message).
Trigger now
Trigger now runs a schedule once, now, without changing its cron cadence or its next scheduled occurrence. It needs Wolverine 6.38 or later on the monitored service (6.52 for the Timer path).
When it runs depends on the schedule's execution path, the one the Cron column names (Timer or Scheduled message). The two paths are different mechanisms, and the rules differ:
Timer (Wolverine 6.52+) Scheduled message When it runs Now. The node that takes the request publishes the run at once, which ran about 40 ms after the command in a measured case On the service's next recurring tick, not the moment the console confirms. The request is recorded on the schedule's tracking row and the recurring agent publishes the run, on whichever node holds the agent Two triggers Two runs. Each trigger is published on its own (two triggers a few milliseconds apart gave two runs) One run, if both land before the next tick. The tracking row has one slot for a request It is not a second copy of a scheduled firing, on either path. The manual run carries its own deduplication id, so it never collapses into, or doubles, the occurrence the cron will fire anyway.
The console's own guard is narrow. After you click, the button is disabled until the service answers, in that browser only. It does not stop a second operator, or a second tab, from triggering the same Timer schedule and running it twice. Check Last run before triggering again.
A paused schedule refuses it, on both paths. Resume first. This is also how to catch up work a pause skipped: resume, then trigger.
A service with no recurring tracking table records the request on its in-memory agent only, and the console says so, as it does for a non-durable pause. This applies to the Scheduled message path; a Timer trigger publishes at once and records nothing.
The tooltip on the button and the toast after it say whichever of the two applies to that row. A trigger sent by another console or an MCP tool, which carries no row, is worded as "triggered to run once", which is true on both.
A compaction policy's row keeps its own Run now instead, which reports the dry-run answer.
Active and Failing
Active means the schedule is not paused. It used to read Running, which looked like "a run is in progress right now", a different question.
A schedule reads Failing when the last occurrence a monitored node ran failed. The Last handled column says failed: <exception type> and how long the handler ran. Wolverine records only the exception's type on the run, not its message; the message is on the Dead Letters page. The outcome always belongs to the newest run any node reported, so a node that saw an older success cannot hide a newer failure. A service on a client older than 1.1 reports no outcome, and the column says nothing rather than claiming success.
Paused, Service down and Never fires rank above Failing, because whether a schedule fires at all matters more than how its last firing went.
For a compaction policy the Last handled outcome is the compaction's own result (refused: …, partial: 1 of 2 scopes failed, compacted 3 of 4), not just that the schedule's handler returned. The grid and the schedule's own page read it from the same place, so they cannot disagree: a policy refused on every run never reads Failing beside a green succeeded.
One schedule, drilled into
Click a schedule's name for its own page (/schedules/<service>/<schedule>). It answers "is this job healthy?" in one place:
- Definition: the cron pattern and its label, time zone, the message type it publishes, the next occurrence with the instant that reading was true, and whether a pause would survive a restart.
- Last run: when it was handled, whether it succeeded or failed (with the exception type), and how long it ran.
- Recent runs: the newest 20 attempts the console has seen across every node, with a "3 of 20 failed" summary. Runs in a row with the same outcome share a line, which says how many there are and how far back they go, with the range of their durations and the nodes that ran them, so a policy refused on 14 runs prints that sentence once. Show each run lists them under it with their own time, duration and node. Only consecutive runs fold: a success between two failures breaks the line, so a job that fails and recovers looks different from one that fails every run. A retried occurrence counts each attempt. A Run now is never folded into a cron tick, and keeps its
manualtag. This is what the console observed, not the schedule's whole history: runs from before the console was watching are not here. Your tracing backend has them, since Wolverine tags each occurrence span with the schedule name. - Pause / Resume / Trigger now, as on the row, and Run now on a compaction policy.
- Failures: opens the Dead Letters page on exactly this schedule's dead letters: its message type, and the
recurring-scheduleheader naming it. A service on a Wolverine older than 6.52 cannot filter by header, and the Dead Letters page says so rather than showing every message of that type as the schedule's.
Monitored services need the 1.1 client to report run history; an older one reports the last run at most.
Service down
A schedule reads Service down when its service has no running node in the console. Nothing is firing the schedule, so the row stops asserting what belonged to a process that is gone: it shows no next occurrence and no owning node (Timer · service down). This comes from the service's node list, not from how old the reading is.
A Pause or Resume sent to such a row is queued and applies when the service returns, however long that takes; the button says so. Trigger now and Run now are not offered while the service is down, because a queued run has no expiry and would fire once, whenever the service comes back.
An owning node that is not among the service's current nodes is treated as no owner on every row, so a paused timer schedule stops naming a node that died in an earlier restart. A timer schedule you just resumed reads agent starting until a node claims its agent, rather than no node running it.
Never fires
A schedule reads Never fires when its service runs in the Serverless or MediatorOnly durability mode and has durable message storage configured. Wolverine starts no agents in those modes, so the schedule is registered, announced, and completely inert. It is a misconfiguration, and showing it as Active would be the most misleading thing the page could do.
A service in one of those modes with no message store at all is not flagged: Wolverine starts the recurring agent directly, in memory, for a storeless host, so those schedules genuinely do fire.
Compaction policies
A stream compaction policy is driven by a recurring schedule, so each policy is a row here and everything above applies to it: pause, resume, the next occurrence and Last handled. Three things are particular to a policy's row:
- A badge says whether it is armed. Compaction · dry run reports what it would compact and changes nothing; Compaction · ARMED deletes events irreversibly from the streams it selects. Compaction is invisible from the read side, so this badge is where the difference shows before you act. Arming is a code change, never a console action. The badge sits under the State tag, so a Failing or Paused policy still shows it.
- The row is named for the policy. A policy's schedule is called
critterwatch-compaction:{policy}, so the policy's own name leads the Schedule cell and the shared prefix is muted on the line beneath it. The link still opens the schedule's page. - Run now runs the policy once instead of waiting for its cron, in place of Trigger now, and reports its outcome: the failure and its reason, or what a dry run would have compacted. It is on the row and on the policy's own page, so you can run the dry run again from the page that shows why it failed.
Failingreads from the runs already recorded, as soon as the page loads, when the policy's last run failed. Every run, with its counts of streams matched, compacted, skipped and failed, is on the Timeline.
What you cannot do from here
One omission is deliberate rather than unfinished:
- Authoring or editing a schedule. Schedules are code-first, and Wolverine exposes no API to add one or re-crontab one on a running host. A button here would have nothing to call — change the registration and redeploy.
Multi-tenancy
Recurring schedules live on the main database only — never per tenant, and never in an ancillary store, including in a modular monolith. A multi-tenant service has one set of schedules for the whole service, and this page renders them as exactly that.
For agents (MCP)
The same surface is available over MCP: list_recurring_schedules to read them (with each schedule's last-run outcome and run history), and pause_recurring_schedule / resume_recurring_schedule / trigger_recurring_schedule to act, gated by the recurring-schedule.pause, recurring-schedule.resume and recurring-schedule.trigger capabilities. Compaction policies have list_compaction_policies, get_compaction_activity, run_compaction_policy (compaction-policy.run) and pause and resume. Running an armed policy, or triggering the schedule that drives one, answers its first call with a preview and a confirmation token (confirmation tokens). See the MCP tool catalog.